Here I come with more insights into the tail/head winds for the construction industry and where it sits in its valuation.
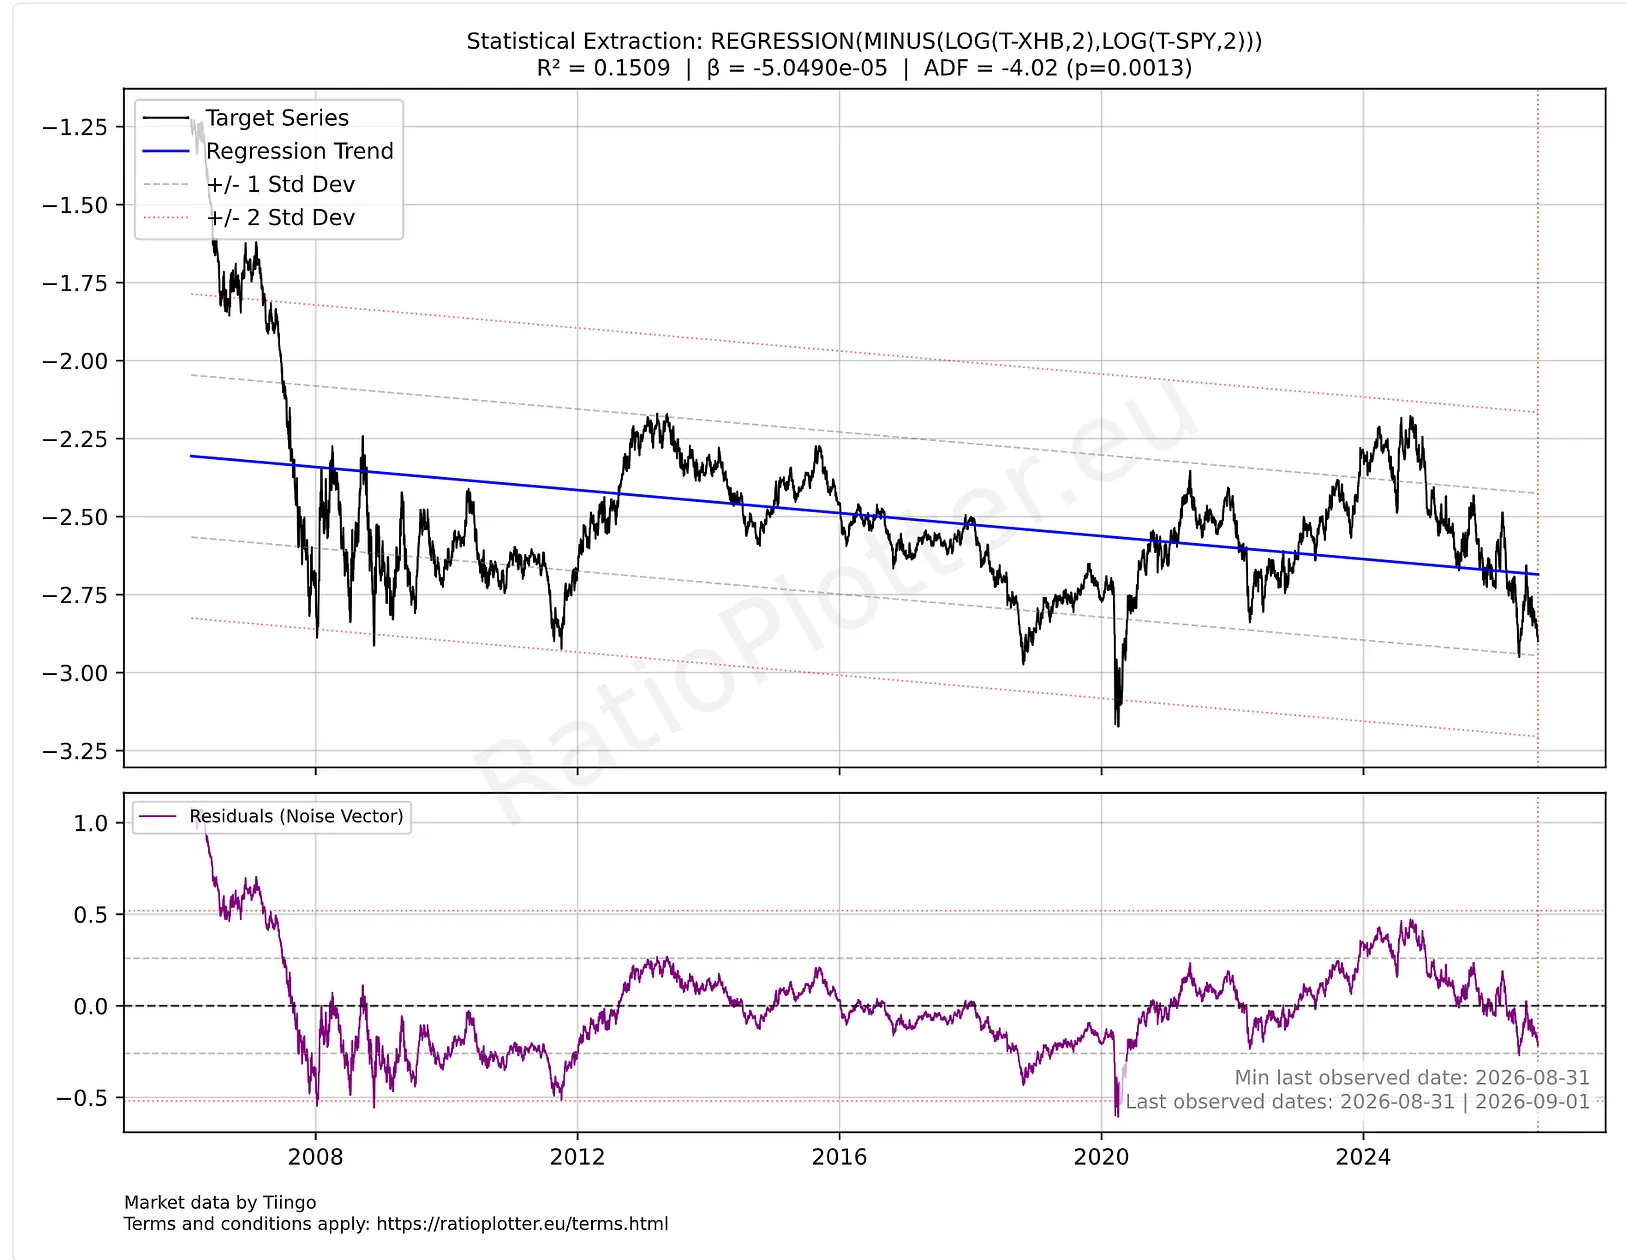
Below we see a Constrained / Ratio Spread model in between the T-XHB and the T-SPY. T-XHB is the State Street SPDR S&P Homebuilders ETF. And T-SPY is the S&P. We see that the price spread of the Home Builders Industry against the S&P is nearing minus one standard deviation. The ADF probability of 0.0013 is not good, it is excellent, meaning there is about 0.13% probability that the mean reversals seen here since 2007 (before home crisis) are by chance, a fluke. Whoever is shorting the S&P can for instance start buying home builders. Berkshire recently acquired a home building company, Sumitomo Forestry is coming all the way from Japan to invest in home building in the US, etc. I personally think the bottom may be more towards 2 standard deviations. And the fact that the home builders are cheap against the S&P does not mean that both cannot be expensive in terms of CAPE ratio. I had a look at Sumitomo Forestry and is a beauty of a vertically integrated company, a moat against all these companies trying to do just one part of home building. Invent Wood’s Superwood is another tail wind for this industry, as wood is about to get way cheaper and effective, and that drives demand that did not exist before for building with wood (Jevon's Paradox). What I think is missing on the full picture is the stagnating world population affecting building demand, but if we talk about USA population only, then there is growth and is relatively a young country. Have fun and keep the discussion rolling, I am keen to see your models and feature requests. An up-to-date chart is available for ratioplotter.eu subscribers:
This article is for educational purposes only and does not constitute financial advice. Past performance does not guarantee future results. Always conduct your own research or consult a qualified financial advisor before making investment decisions.