Is the current extreme price spread between US and Indian Equities due for a mean reversion or just the start of a structural regime shift?
Statistical arbitrage models rely heavily on the assumption of stationarity: when two assets are cointegrated, extreme deviations in their spread present mean-reversion opportunities. However, quantitative models are blind to structural shifts. When a pair breaks down, capital deployers need to determine whether they are looking at an extreme statistical outlier awaiting for a mean reversion or an ongoing regime change.
The Engle-Granger cointegration model between the S&P 500 (SPY) and MSCI India (INDA) currently presents this dilemma.
The Cointegration Baseline
Historically, SPY and INDA have maintained a robust statistical relationship.
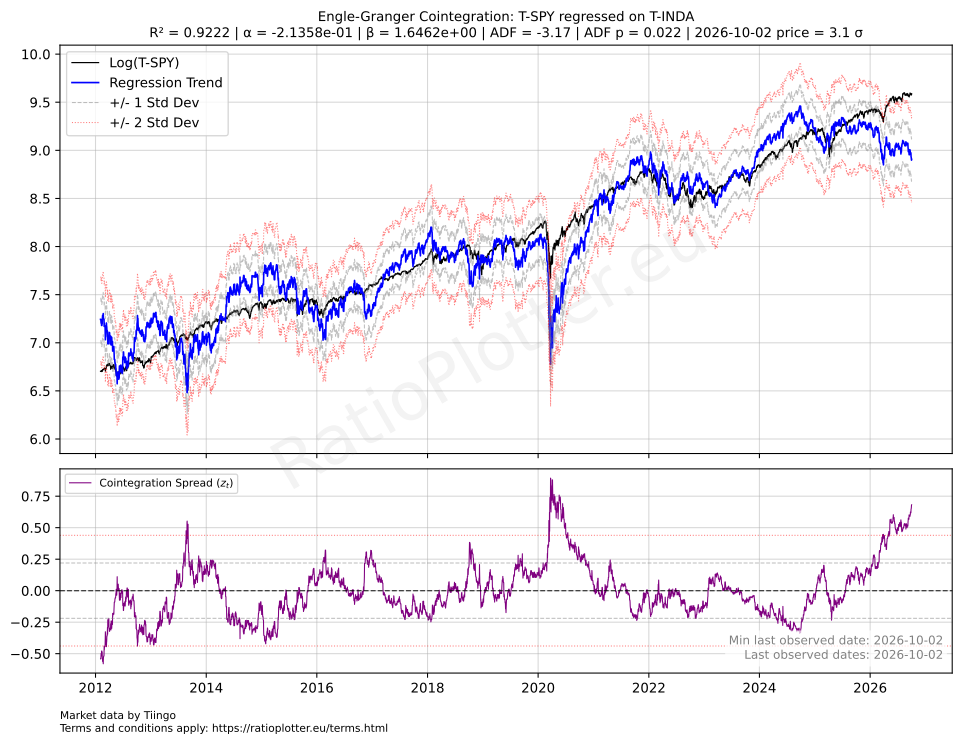
- ADF p-value: 0.018 . This is by far one of the best cointegration model pair scores in our platform.
- R²: 0.9224
- Beta: 1.6453
With an Augmented Dickey-Fuller (ADF) p-value well below the 0.05 threshold, the residual spread between SPY and INDA has historically proven to be stationary. The probability of this long-term coupling being a statistical artifact is minimal. Or if you want, the probability of mean reversion is very high.
Reserved for plotting an up-to-date chart.
The Extreme Deviation: Mean Reversal or Structural Break?
As of late September 2026, the cointegration spread z in between the S&P and INDA has reached 3.0 standard deviations 3.0 sigma above its long-term mean. The 3.0 standard deviations pull away from the mean is by far one of the highest for high quality models in our platform. Statistically, this is a very rare event expected to sit above 99.87% of all data points in the population.
In a standard pairs-trading framework, a +3 sigma move represents a short SPY / long INDA opportunity, banking on a return to historical equilibrium. However, individual exponential growth regressions for each asset reveal two conflicting trajectories rather than a cyclical divergence! Let’s dive into it.
India (INDA): Losing Momentum
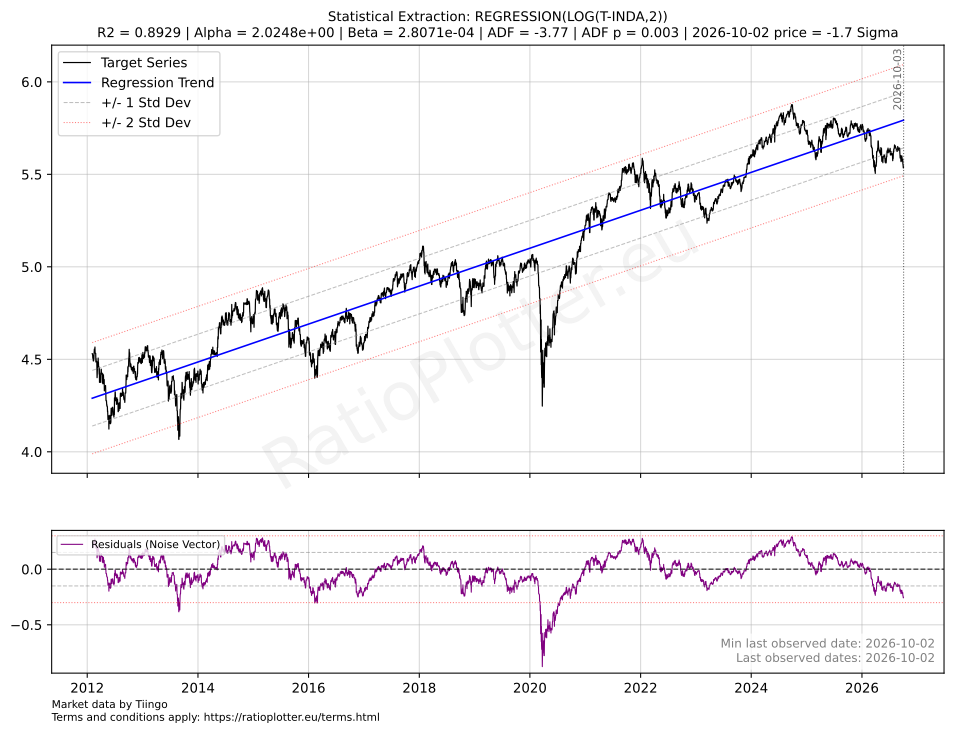
Looking at the standalone log-linear regression for INDA (REGRESSION(LOG(T-INDA,2))), India's exponential growth trend is flattening. The current price sits at -1.6 sigma below its long-term regression trend. This slowdown occurs despite broader market metrics where many country ETFs remain elevated relative to historical CAPE ratios and Buffett Indicator metrics (see for instance: https://ratioplotter.eu/buffett_indicators.html). Has India been this low before? Yes. Has it previously returned to the mean? Yes, and the model is stationary (ADF p = 0.003) which backs such mean reversion. Do the fundamentals and market structure indicate it will return to the mean this time? Read along.
Reserved for plotting an up-to-date chart.
S&P 500 (SPY): Accelerating Above Trend
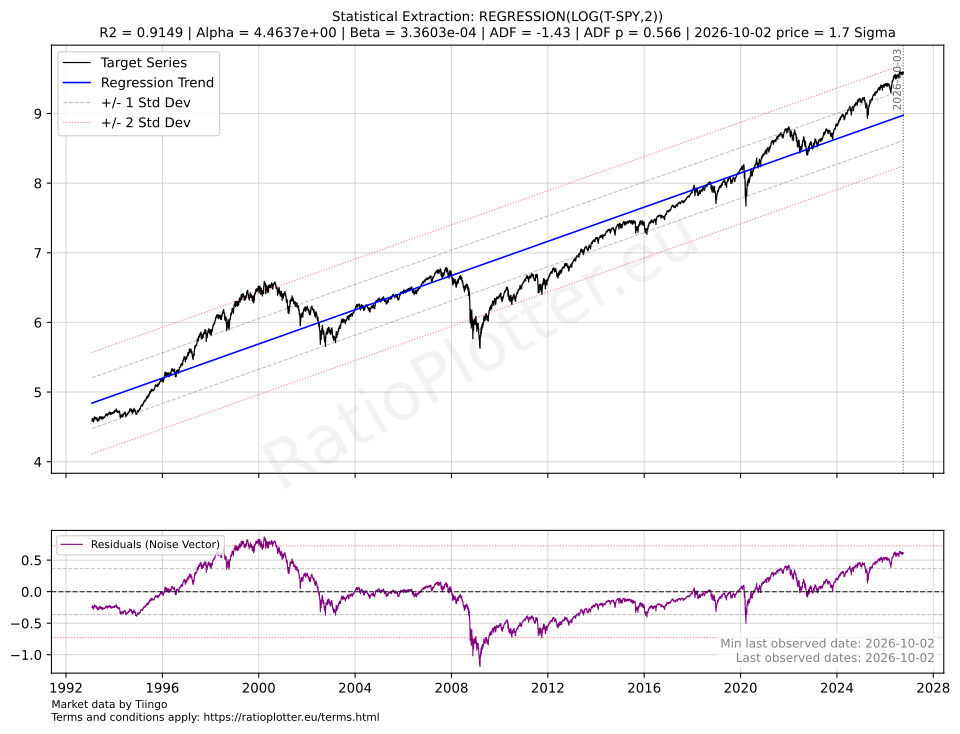
Conversely, the log-linear regression for SPY (REGRESSION(LOG(T-SPY,2))) demonstrates persistent upward acceleration, pushing the index to +1.7 sigma above its long-term exponential growth channel. Has it been this high before? Yes, in the dot com bubble in 2000. Has it returned to the mean? Yes, but the model is not stationary (ADF p = 0.561). Will it return to the mean this time? It is harder to infer from the model as it is not stationary, perhaps structural causes are a better place to look at for a cause for mean reversion.
In sum, instead of both assets fluctuating around a shared economic baseline, with both appreciating, but the SPY growing stronger, we have the SPY and INDA trending in opposing directions relative to their respective historical growth vectors.
Reserved for plotting an up-to-date chart.
Macro Hypotheses: Labor vs. Capital & Energy
Do we have one cause for the S&P appreciation and a separate cause for the INDA depreciation? Or the same cause (AI) is behind the recent price changes in both assets?
While price charts highlight the divergence, macro factors offer potential explanations for a structural shift:
- The Artificial Intelligence Factor: The rapid adoption of AI technology primarily benefits capital-heavy, tech-dense index components (which dominate SPY). If AI restructures the global economy into one less constrained by offshore labor and more constrained by compute, energy, strategic minerals, and advanced hardware, market pricing will favor US equities and countries with a high ratio of compute, energy, strategic minerals, advanced hardware per capita.
- Shift in Relative Supply-Chain Value: India’s secular growth thesis has relied on its demographic dividend, technology services, and labor pool. If generative tools compress software labor costs while elevating demand for physical resources (power grid, specialized manufacturing, infrastructure), global capital flows may reallocate accordingly.
Note: For quantitative traders, these macro narratives serve only as contextual hypotheses. The primary focus remains on market pricing. For value investors and others interested in the fundamentals, the charts are just the tip of the iceberg, a deeper analysis is required (see “What to Watch” section).
Quantitative Takeaways
- Failure of Mean Reversion: If the divergence is driven by a fundamental macroeconomic shift, classical mean reversion trades +3.0 sigma carry elevated tail risk.
- New Spread Baseline: During a regime shift, cointegration models break until a new equilibrium is established. The spread may not return to zero z = 0, but rather plateau at a higher baseline.
- Model Recalibration: If the current decouple persists, the historical dataset prior to 2024–2026 will introduce bias into cointegration parameters. Quant models will require sub-sample re-estimation such as making a new model for the period from 2026 onwards, or will require structural break tests (e.g., Gregory-Hansen test) to assess post-AI cointegration parameters.
What to Watch
Market prices often discount structural shifts ahead of macroeconomic data. If SPY remains elevated above its growth trend while INDA struggles to recover its historical slope, the historical cointegration pair will be invalidated, signaling a permanent recalibration of global asset pricing.
Further Analysis and Potential Opportunities
A further study revealing which sectors in India are most affected could back the AI causation thesis for the loss of the cointegration, even though Indian companies in those sectors may not yet be experiencing an impact to their bottom line. This analysis could also reveal value investment opportunities, for instance in pharmaceutical generic drug manufacturing, that are not necessarily affected by the AI factor as much as call centers or consulting companies.