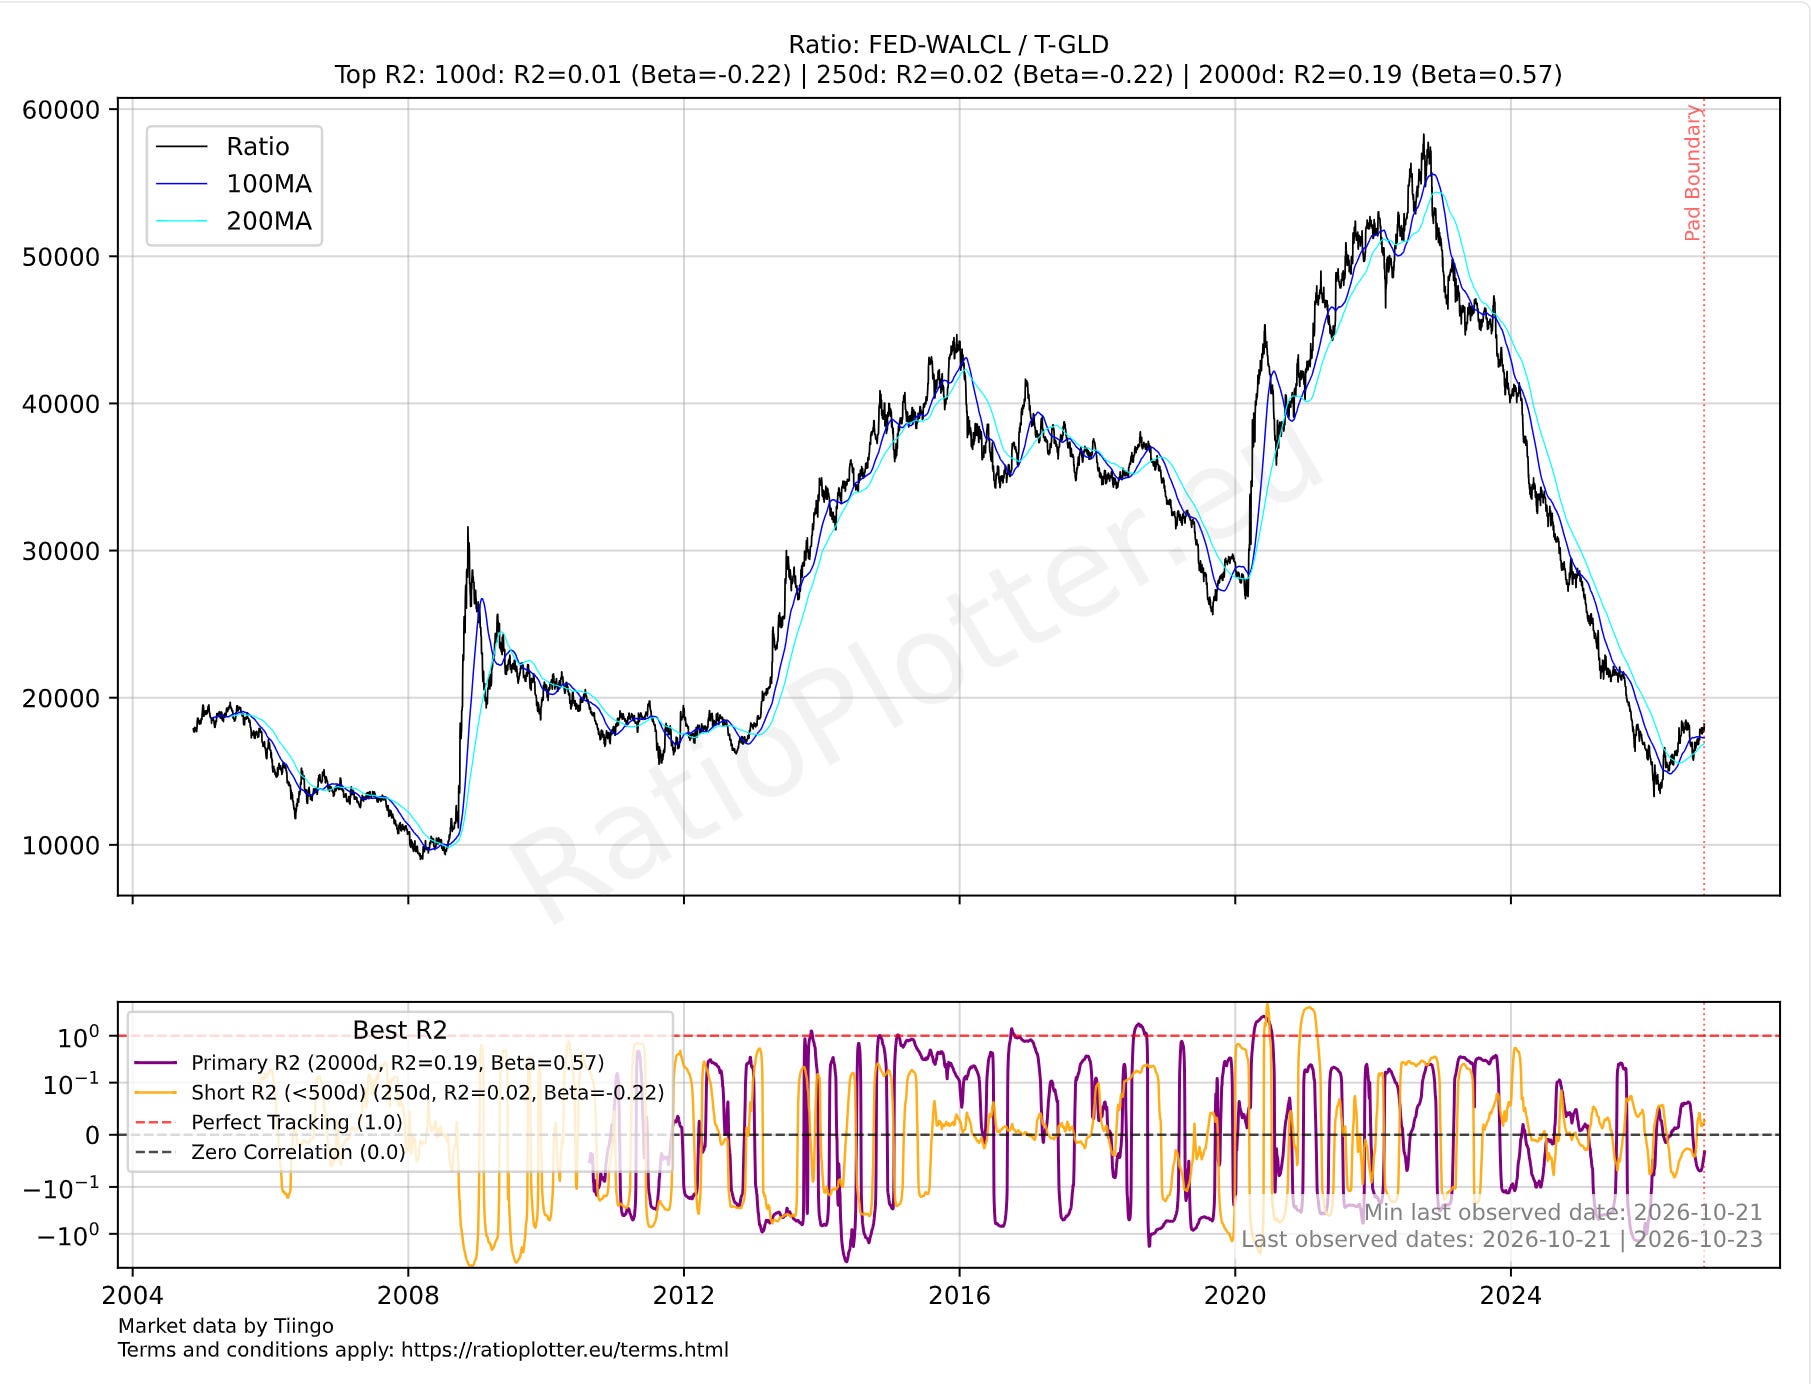
The Fed balance sheet priced by a gold index fund. The results are how many shares of the SPDR Gold Trust the Fed balance sheet amounts to.purchase.
We obtain data in real time from the Federal Reserve API (ticker FED-WALCL in our platform) and divide it by the price of gold the SPDR Gold Trust (ticker T-GLD). At a glance, one can see a striking narrative: when priced in gold, the Federal Reserve balance sheet is virtually unchanged from its 2004 level. Even the dramatic expansion during the COVID-19 pandemic looks like a temporary spike that quickly mean-reverted toward historical baseline levels.
This observation raises fundamental questions about money, asset valuation, and central banking.
What Is the True Unit of Account?
- Is Fiat Money Misleading Us? In nominal US Dollars, the Federal Reserve’s total assets exploded from under $1 trillion in 2004 to over $8 trillion at its peak. Yet, when benchmarked against gold—a physical asset with thousands of years of monetary history—that immense nominal growth vanishes.
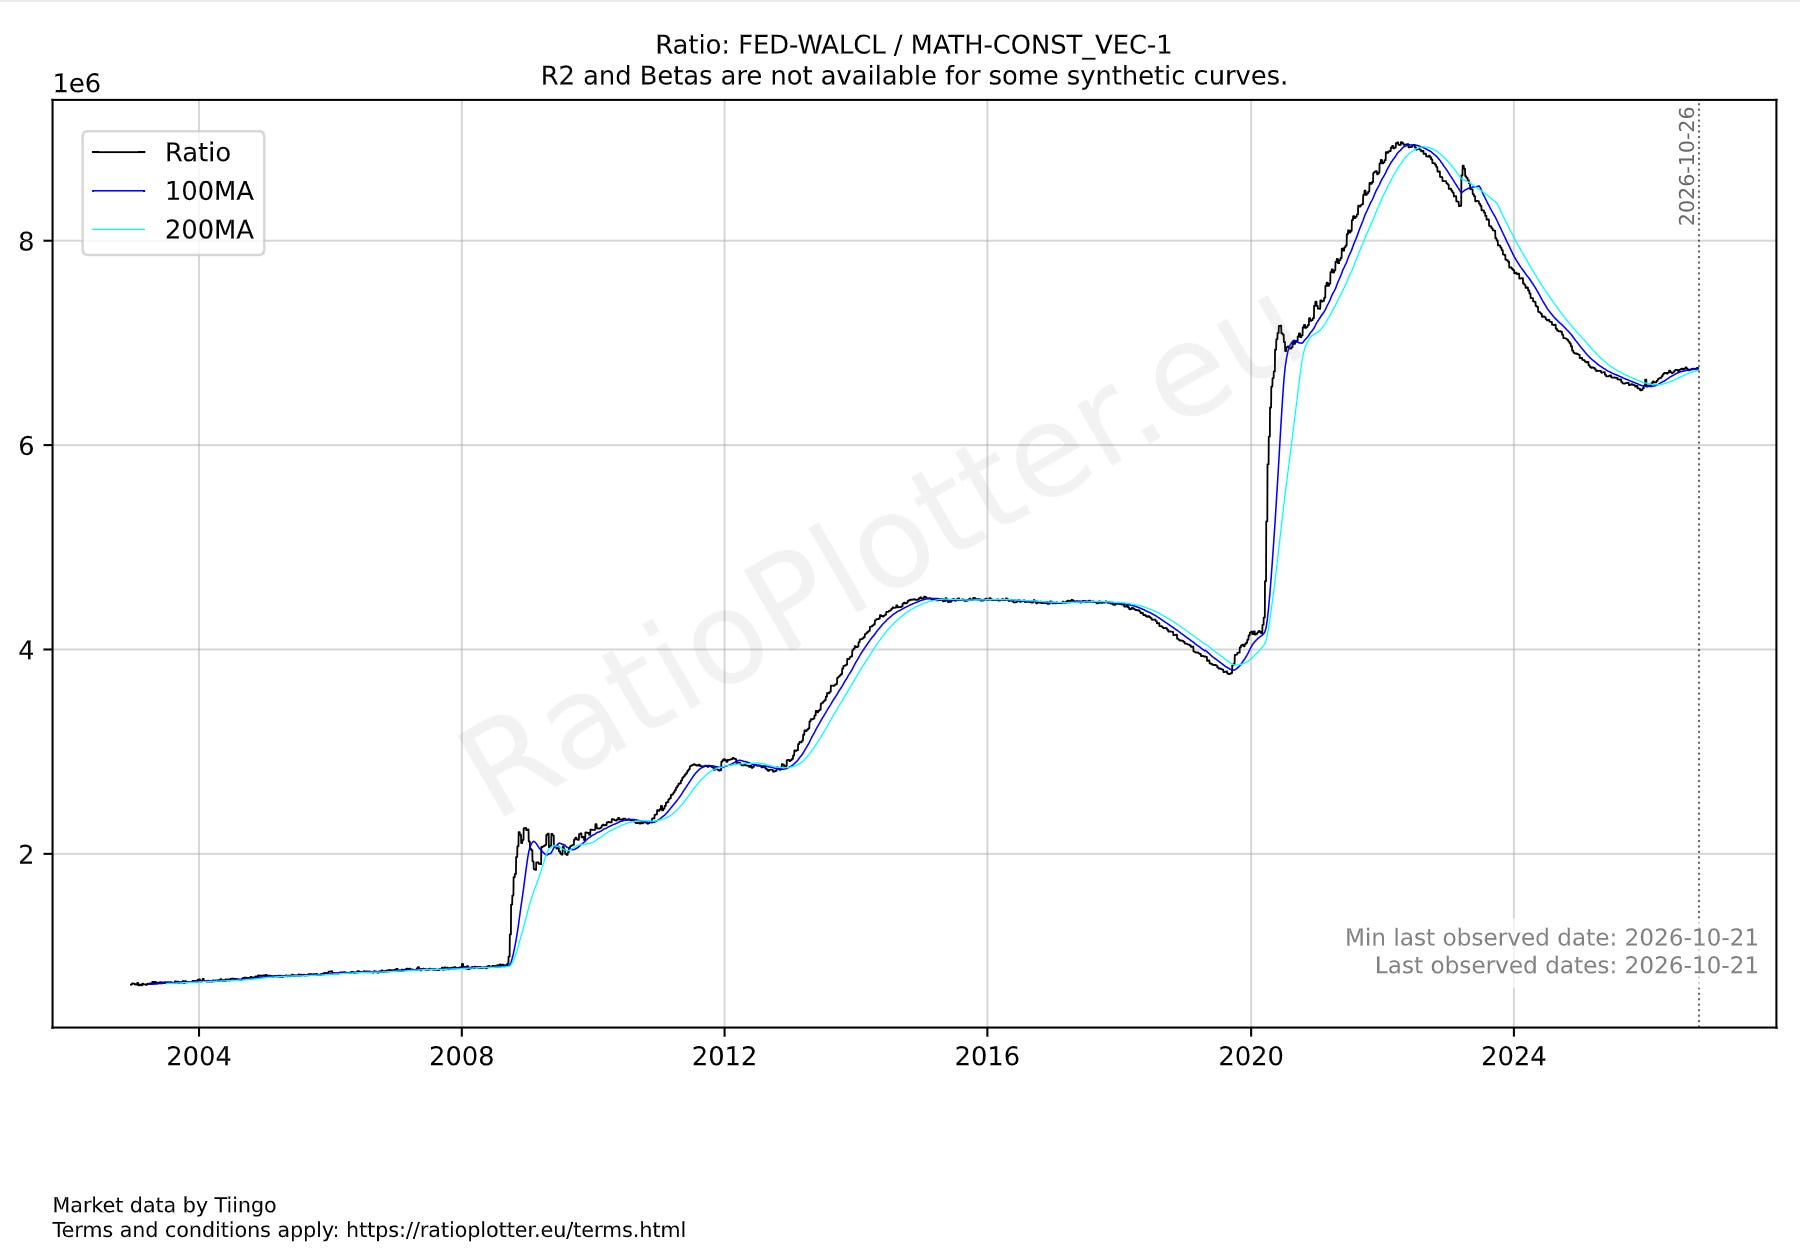
Fed balance sheet in Dollars.
- Is the Fed’s Balance Sheet “Well Kept”? Does this ratio suggest that central bankers have, intentionally or organically, maintained a balance sheet that tracks the true hard-asset standard of the world? Or does it show that gold simply adjusts its price to reabsorb fiat currency creation over long horizons? I mean horizons beyond our current chart.
- Is Gold the Ultimate Measure of Truth? Gold continues to hold a unique position in global finance. Although central banks unpegged their fiat currencies from gold decades ago, central banks and commercial banks hold thousands of tonnes of gold in reserve as a Tier 1 risk-free reserve asset under Basel III framework standards. Gold serves as the ultimate store-of-value anchor—an asset without counterparty risk.
A Search for Truth
When measuring economic reality, the unit of measurement dictates the story. If we judge the Fed by the U.S. Dollar, we see unprecedented monetary expansion and balance sheet volatility. But if we judge the Fed by Gold, we see a balance sheet that sits nearly level with where it was over two decades ago.
Which perspective reflects financial reality? Is fiat currency inflating away, while hard assets reset to maintain true purchasing power equilibrium? Or is the alignment simply a reflection of gold re-pricing paper money creation?
How are the assets of your family and your salary when measured in gold? We are in Europe, where the central bank balance sheet is not so much different, so here is the price of the average German, not American!, house price index converted to gold. It is a down-ride from 100 to 33 since 2004. On paper we have earned so much with our investments, but in the hard asset reality of gold, and what gold prices are telling about the future the message is the opposite.
Let’s have a look at the S&P 500 ticker SPY (State Street SPDR S&P 500 ETF Trust) measured in shares of the same SPDR Gold shares (ticker GLD). First we look at the S&P 500 excluding any gains from dividends (the split only adjusted price tracked in our platform by T-SPY-SplitAdjClose):
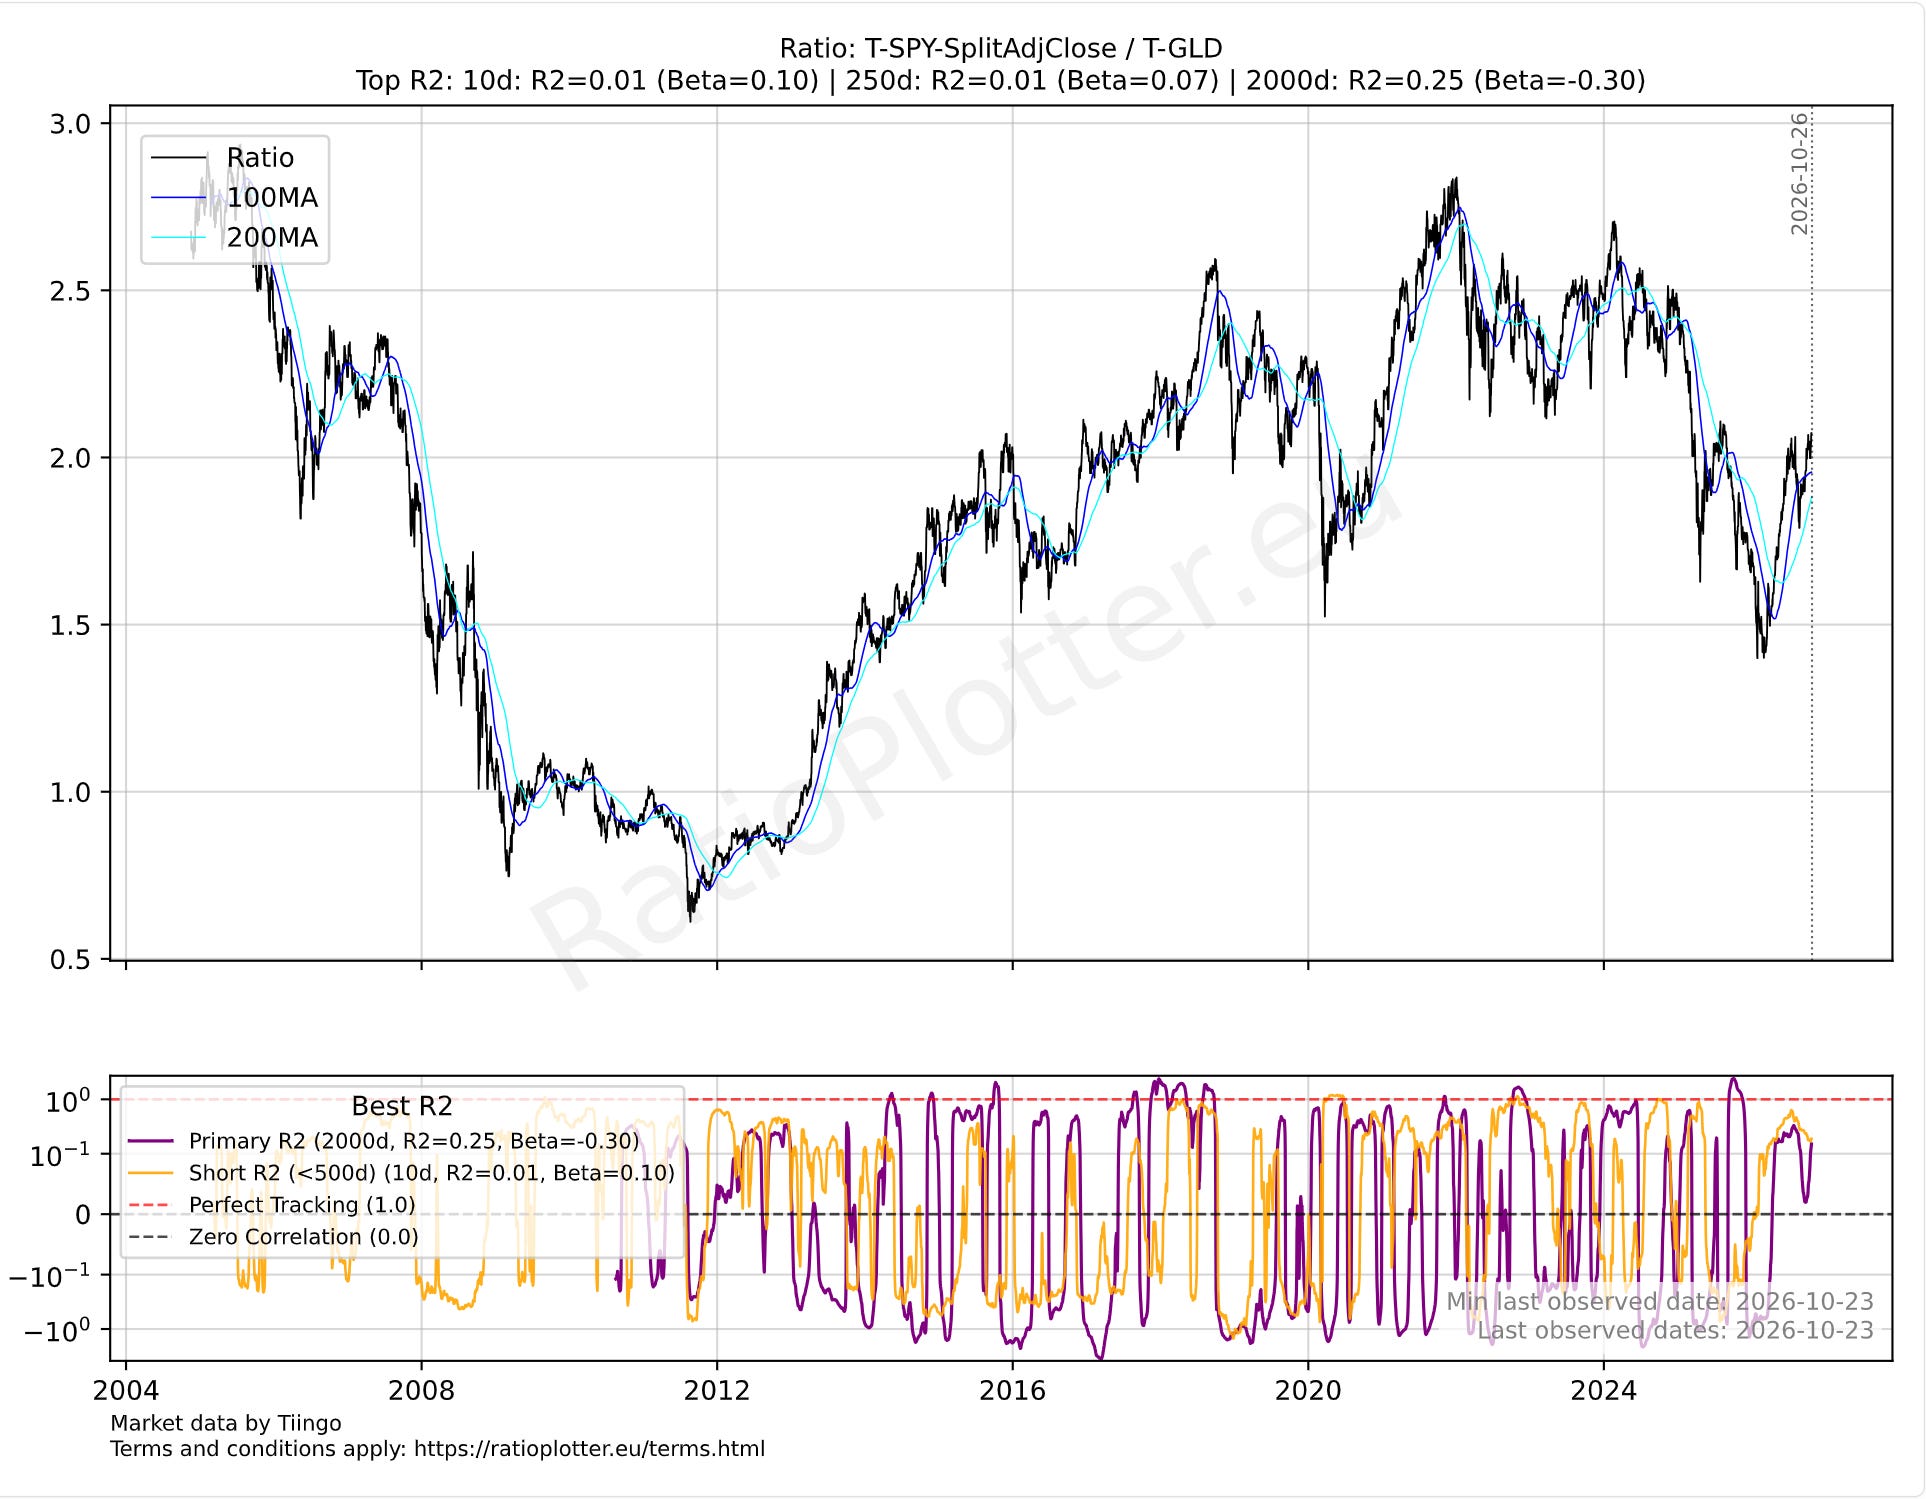
Even with the S&P near all time highs in dollar, the investor has lost money on the share price alone when compared to simply parking his money in gold shares.
How about the S&P 500 when we take into account dividends reinvested in the very same S&P 500 return rate? We plot it below using the ticker T-SPY which measures the dividend reinvested curve:
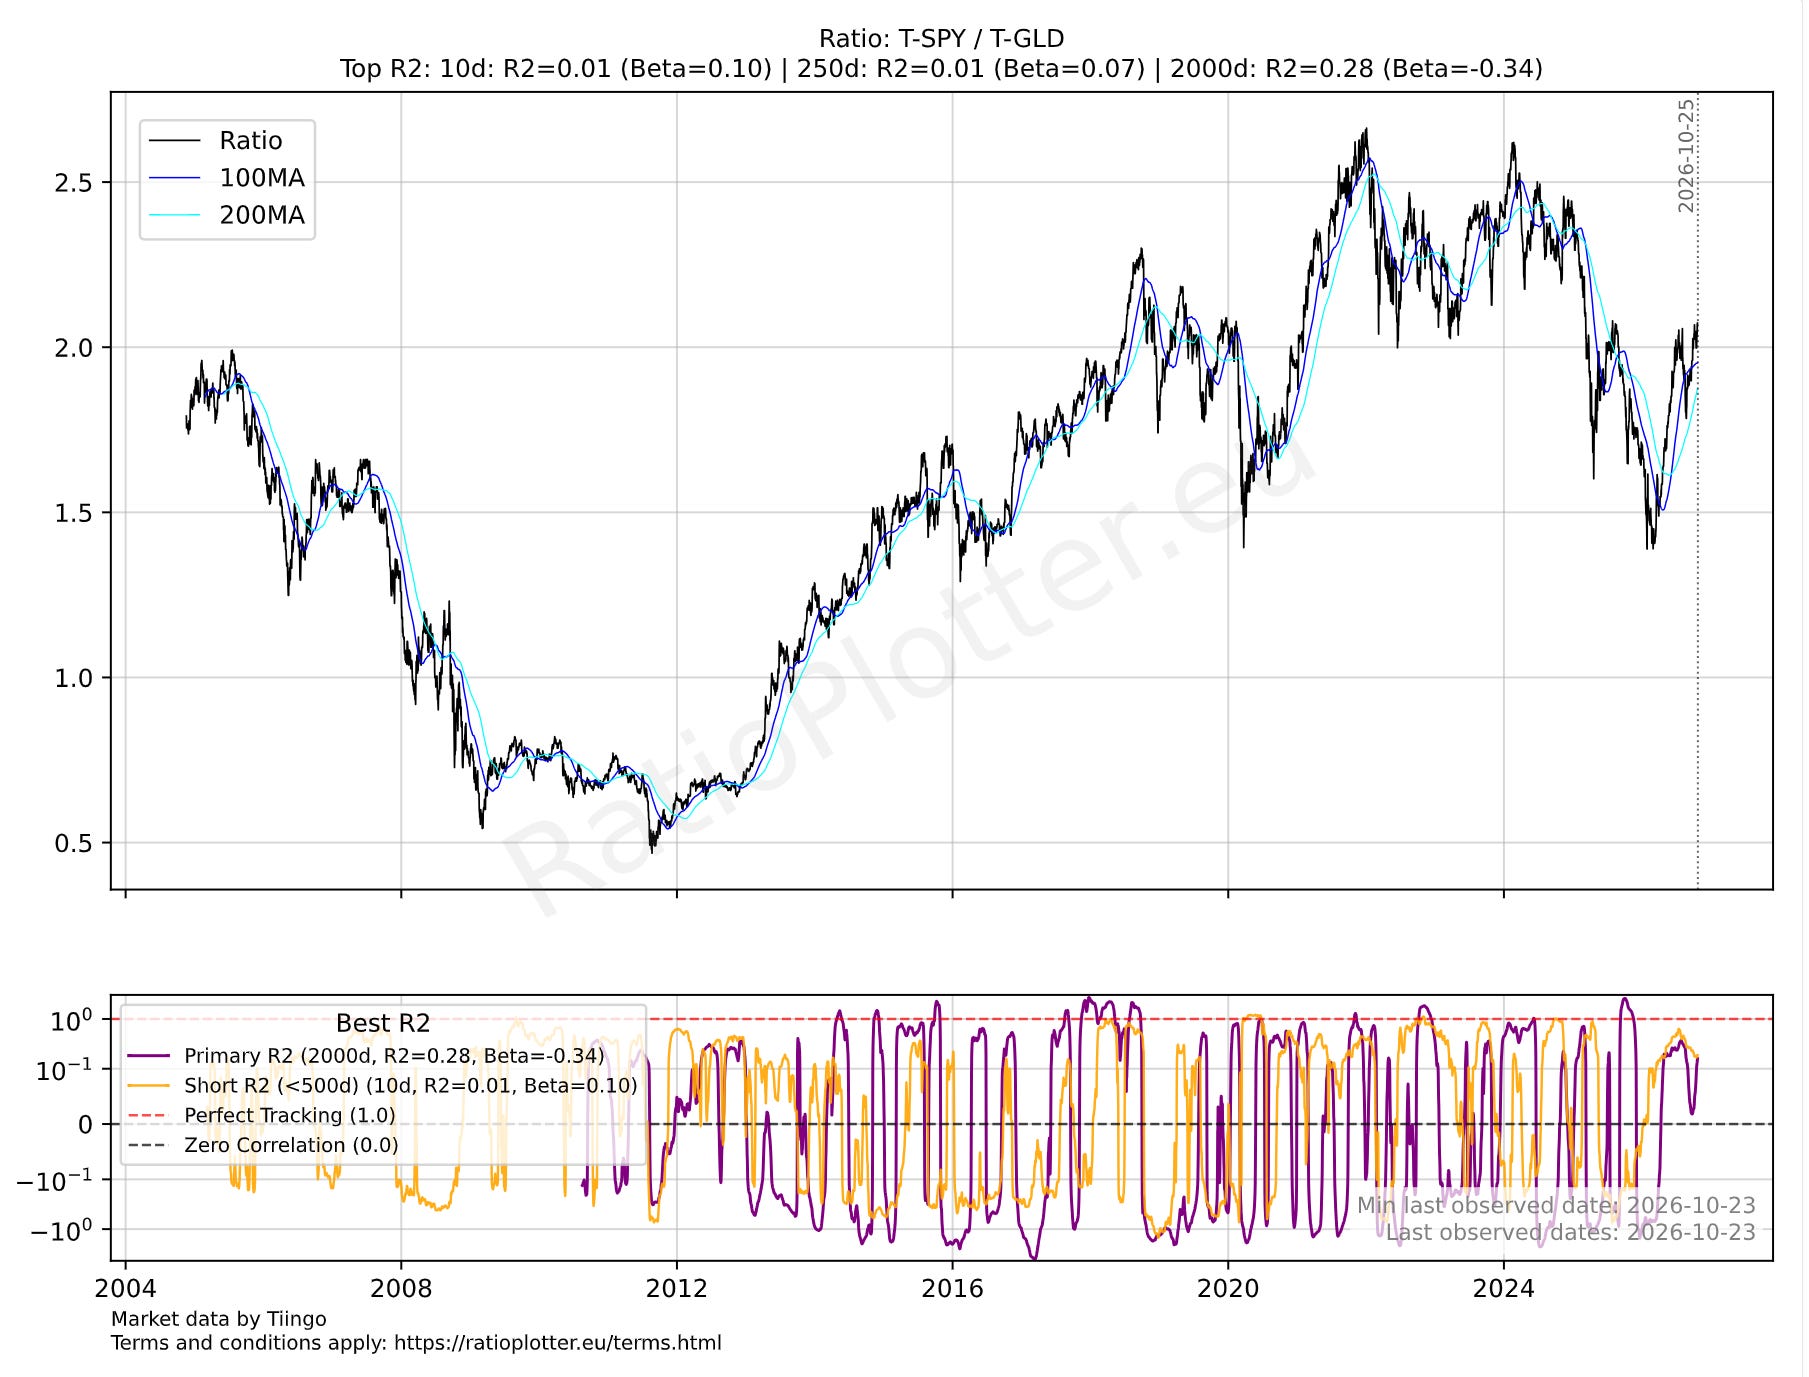
Again, we see the exact same pattern as the Fed balance sheet. On paper, the stock market appears to have marched relentlessly upward; in gold terms, however, even a fully dividend-reinvested index position has largely moved sideways over two decades.
The Fed balance sheet has gone nowhere. Real investment growth in the S&P 500 has gone nowhere. The dollar (and euro) has gone south.
Which brings us to the ultimate question: if paper assets are merely treading water against hard monetary assets, who is actually compounding real wealth—and where is the true north for investors in the years ahead? We invite your thoughts and discussion below.