With continued attacks in Saudi Airspace (today a Houthi missile was intercepted), Brent Oil (ticker BNO) is trading at +2.6 standard deviations against Uranium companies (ticker URA: GLOBAL X URANIUM ETF). You can see the +2.6 standard deviations below on a very robust ADF p = 0.039 cointegration model.
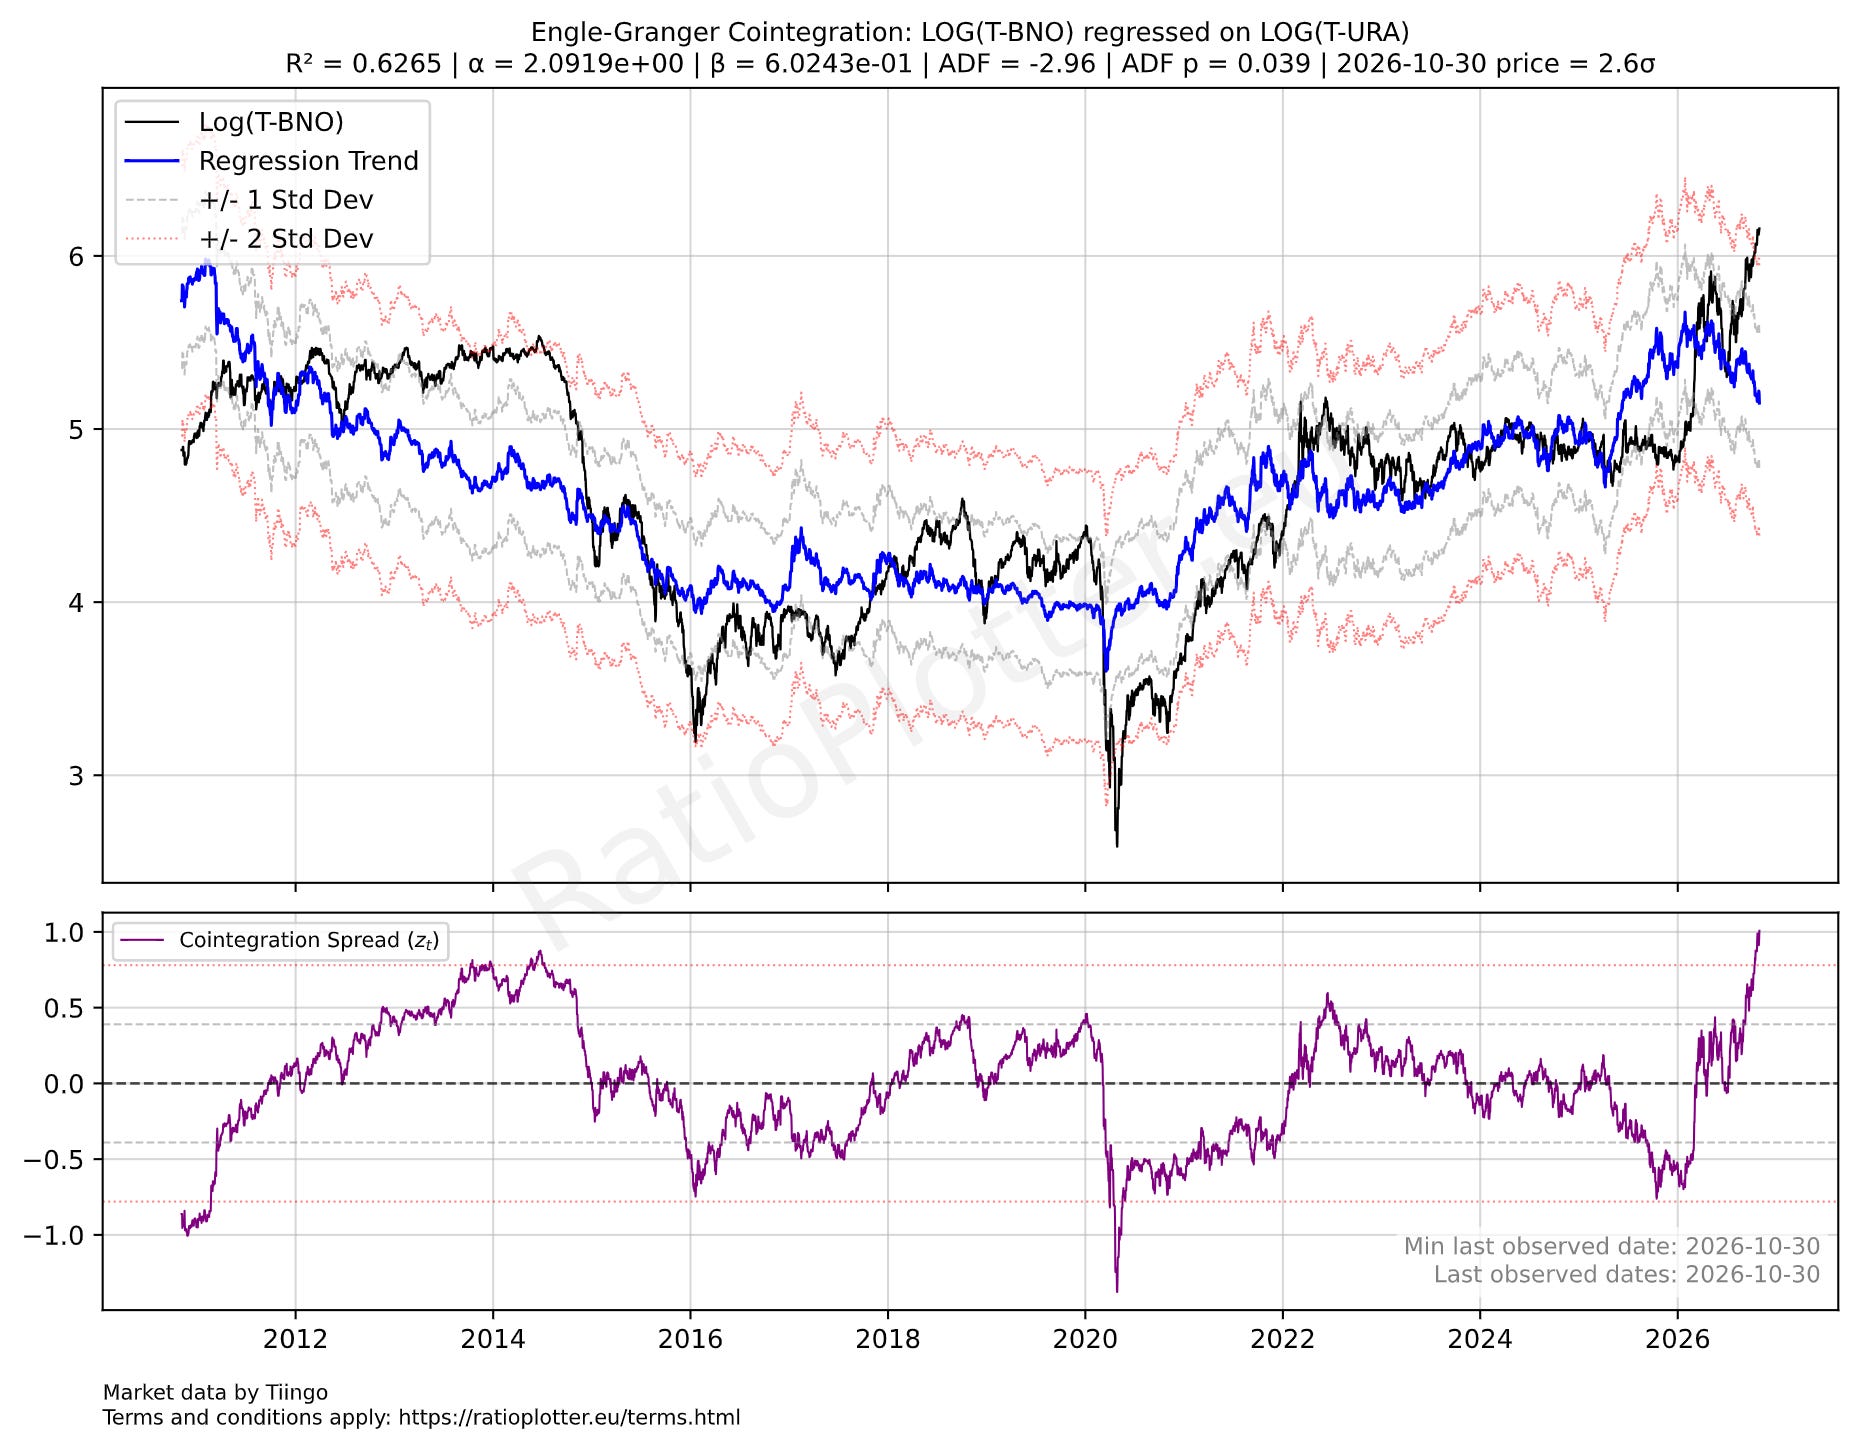
The ADF p = 0.039 indicates the model is stationary and likely to perform a mean reversion towards the blue line, the model line. But which ticker is likely to move to close the spread towards zero standard deviations? How long is the Half-life of this movement? Well that is explained by the VECM model below. The VECM model tells which asset from the pair is likely to move more and faster to close the spread and how long it is likely to take to make this move. Below we see that both assets are likely to depreciate, which means BNO moves to close the gap and actually URA moves against closing the gap as depreciation on URA widens the spread gap. But since URA moves less and since its VECM reliability is the worst here, we cannot really count on that movement.
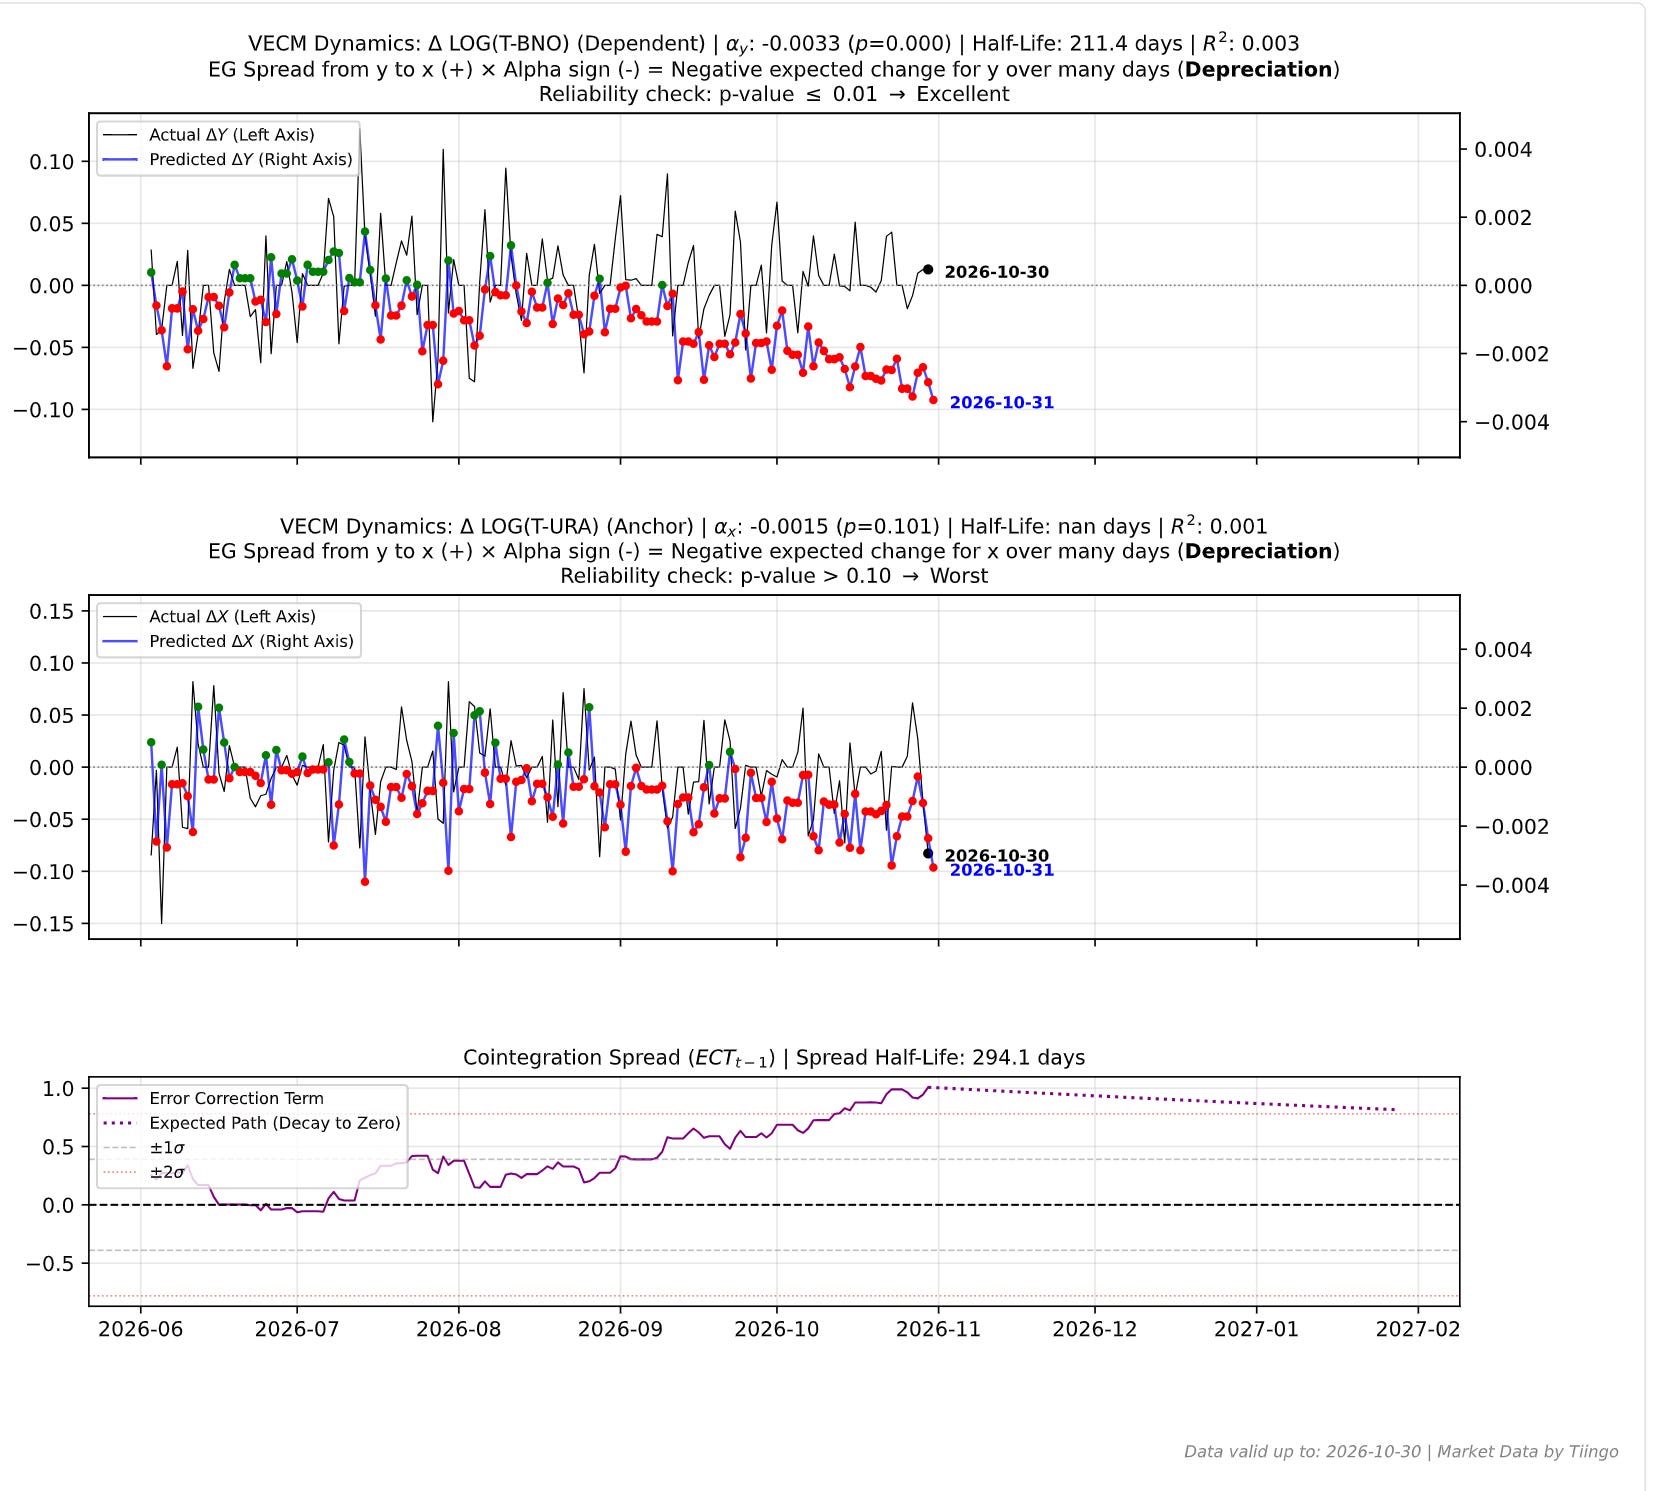
As we can see on the VECM model above, ticker BNO is likely to move down to close the spread. The Alpha y for Brent Oil (BNO) is negative: -0.0033 indicating it is likely to fall to close the spread. The Alpha x for URA is also negative, so it is also likely to fall, which somehow counters my intuition, but since the p=0.1001 is > 0.05 this cannot be relied upon statistically.
But we know from exogenous factors, that oil will go down to close the spread only if Geopolitics allow it to. While the conflict in the Middle East continues, this mean reversion for the BNO/URA spread, in the short term, would most likely come from higher uranium company prices than from lower Oil, even thought he model does not predict that. I say that because of Trump’s comments on waiting for the end of the elections to retake the Iran issue. Yet, to my disbelief, ticker URA fell for quite a while and only now is inching upwards.
So we can say now that the war is working against the model mean reversal by keeping Oil prices artificially high and perhaps also not letting URA prices fall in the low fall rate predicted by the model.
This begs the question of how Uranium companies are valuated. You can look at PE ratios for the ETF and similar. I will show something different here. Below I show how Uranium (ticker URA) companies and Uranium commodity assets are performing against a broad commodity investment strategy (ticker COM: DIREXION AUSPICE BROAD COMMODITY STRATEGY ETF). Well, ticker URA is down a lot, both in terms of standard deviations -1.3 and recent price action. The cointegration model is somewhat robust with ADF p = 0.077 (ideally it would be below 0.05).
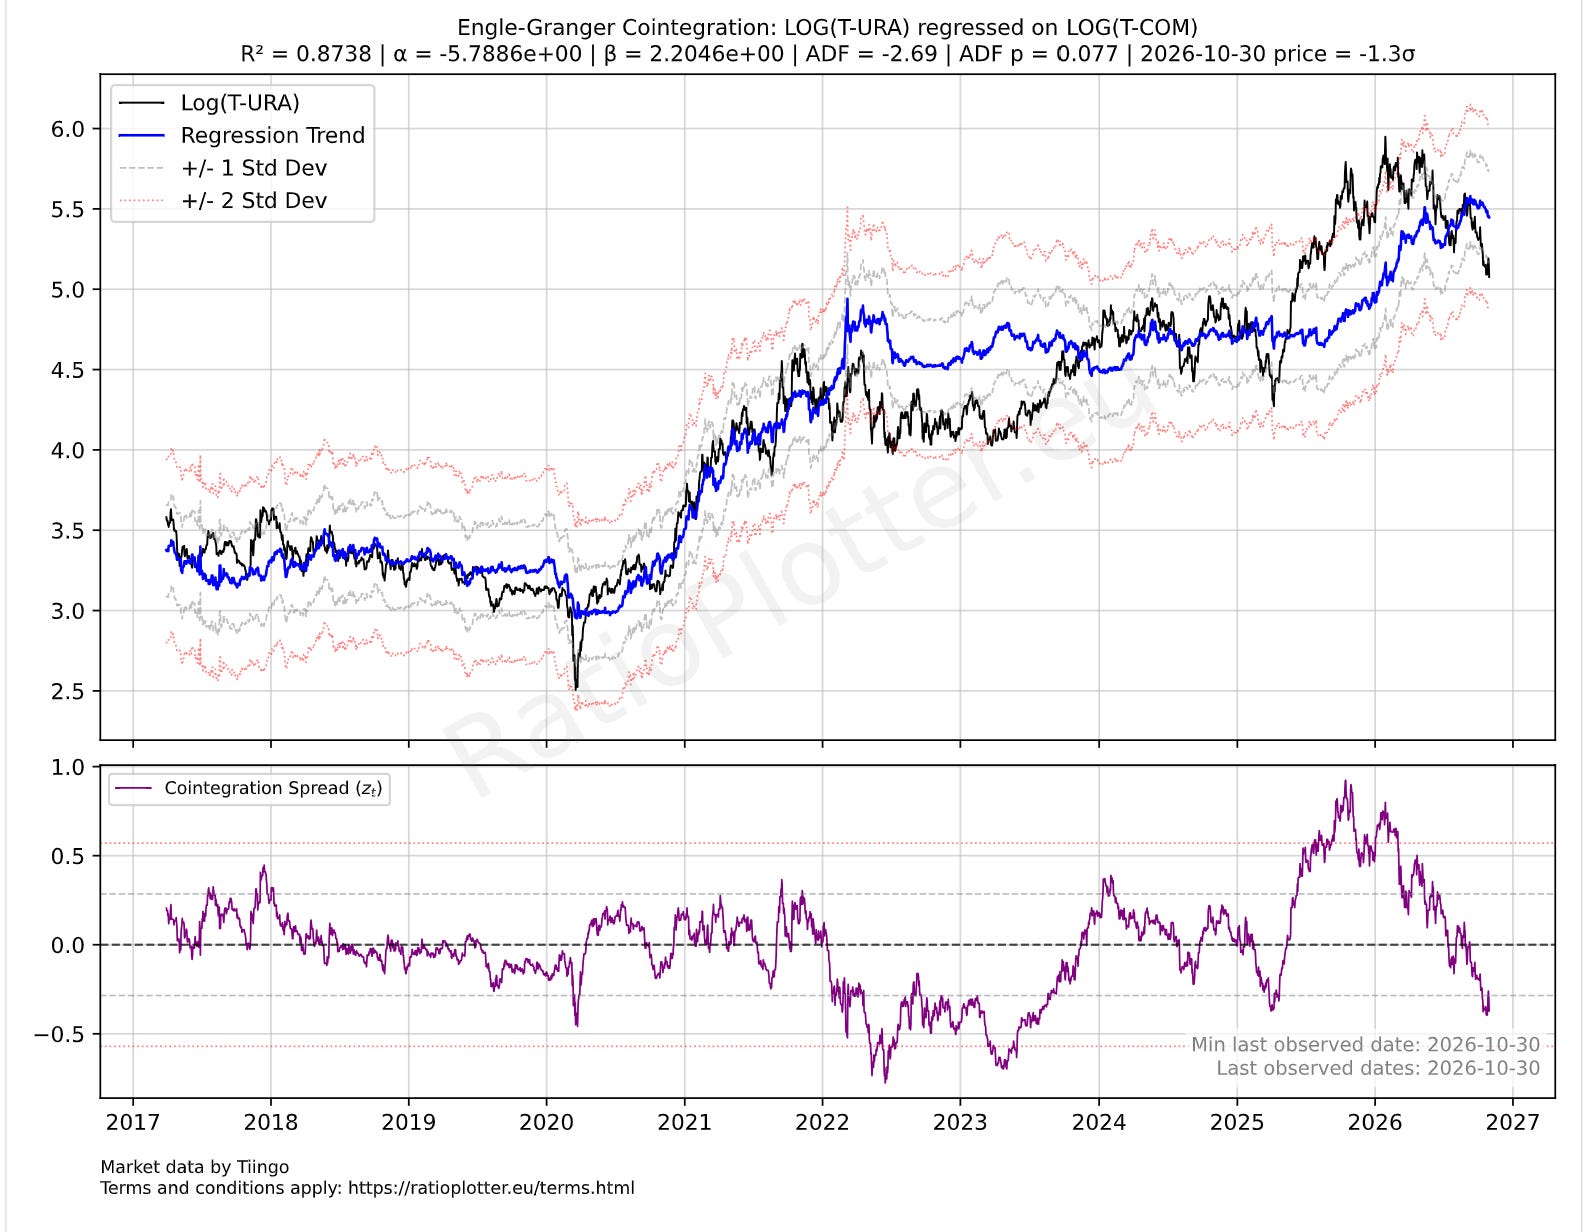
When we look at the Vector Error Correction for the model below we see the following trends:
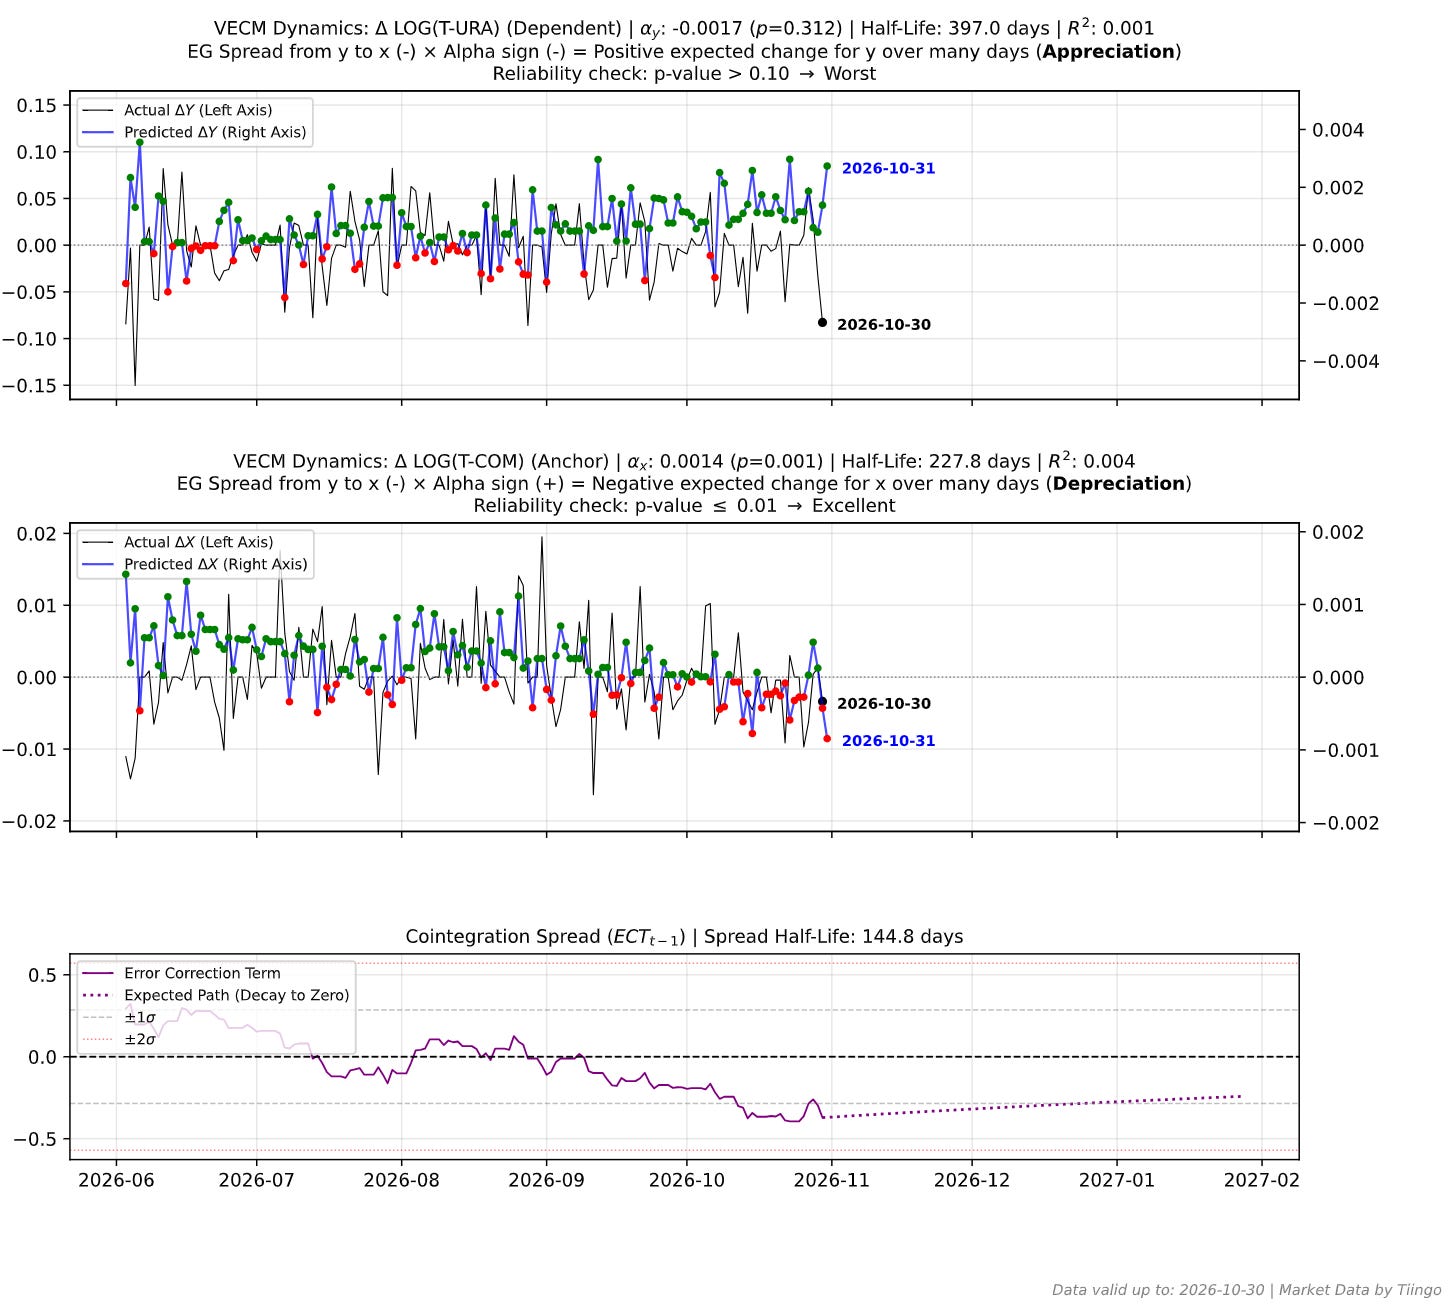
Again, we see that URA is unlikely to move down to close the gap with COM, if anything it will appreciate, but we cannot count on that because the VECM model for URA appreciation has p=0.312 meaning it has p > 0.1 granting it the worst reliability level. What we see is that COM (a broad investment strategy in commodities) is more likely to depreciate to restore the spread URA/COM.
One can also wonder if Oil Up means just a supply shock and Uranium down the last months means anticipation of a period of stagflation where less energy is demanded worldwide. These larger movements may not necessarily be captured by the models, but the COM direction of depreciation above could also match the recessionary macro view.
How do you see the hedging strategy: Short Brent, Long URA? More in terms of timeframes and position sizes? In the worst case one can exit short Brent to buy a calling URA? It seems that URA is not a good hedge because it is unlikely to move up when Brent appreciates.
Do you see other assets that could form part of a larger group of models around the Middle East conflict? For instance agri-commodity prices and fertilizer prices? We have modelled a large part of the network of assets directly impacted in this conflict: Corn, Soy, Sugar, Natural Gas, tickers: MOS, NTR, ICL, BNO, USO. Unfortunately we can only talk about one asset pair at a time here or it would overwhelm the readership. Is there any model you’d be interested on?
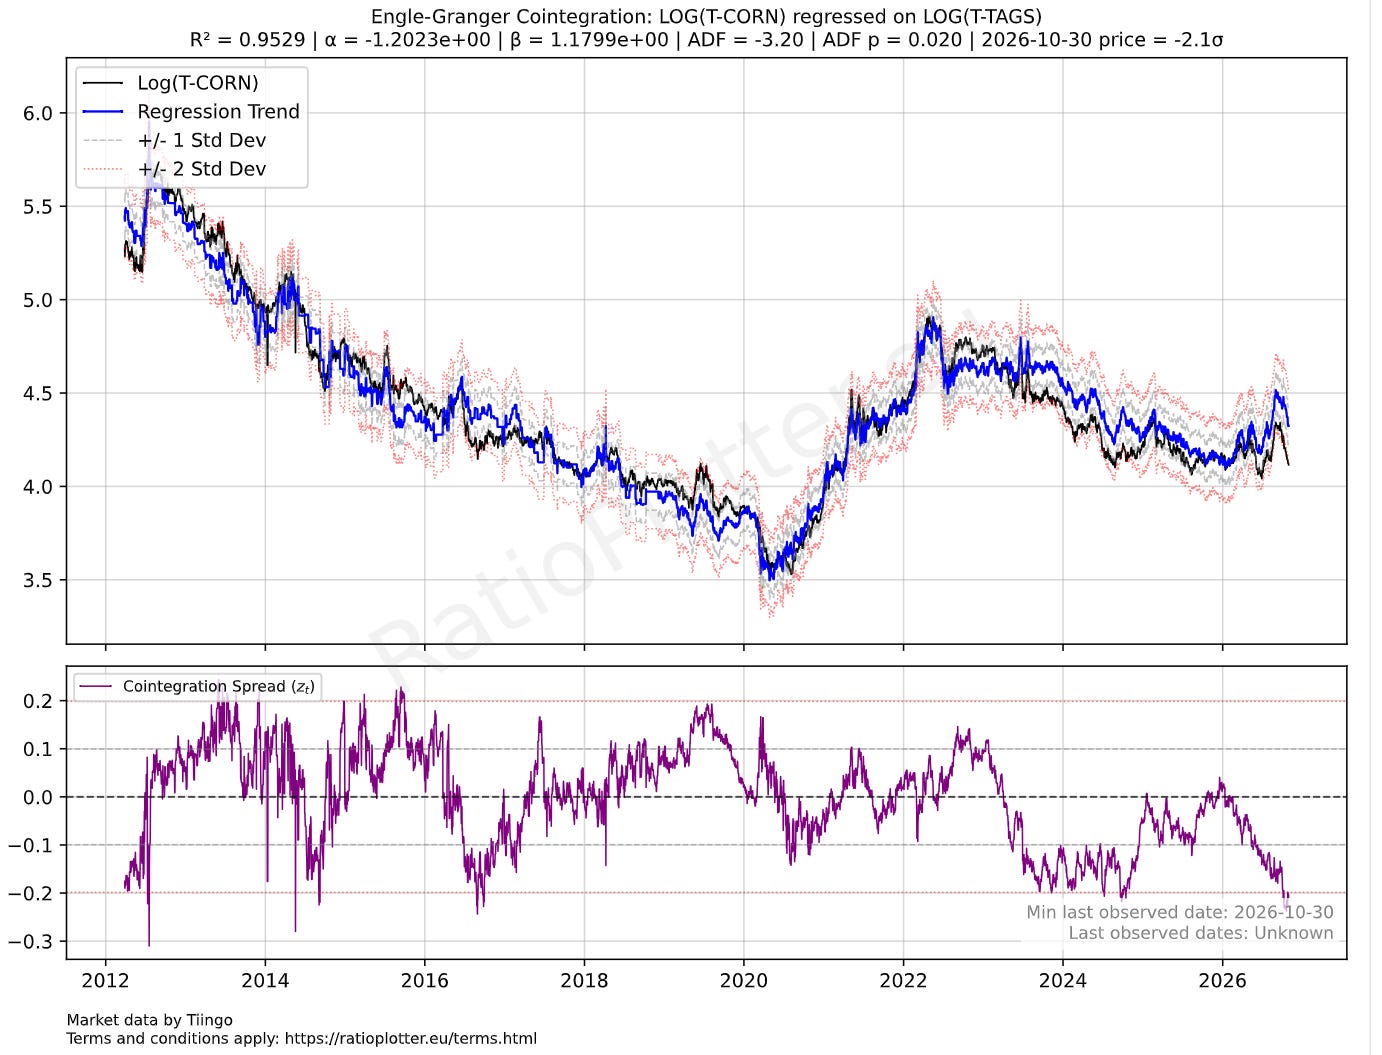
I see ticker CORN as cheap against TAGS (a basket of Agri commodities), most likely due to the superharvest in the US. If Oil continues high that means also high corn prices later. So CORN could be a hedge even though the BNO CORN pair does not have reliable ADF p.
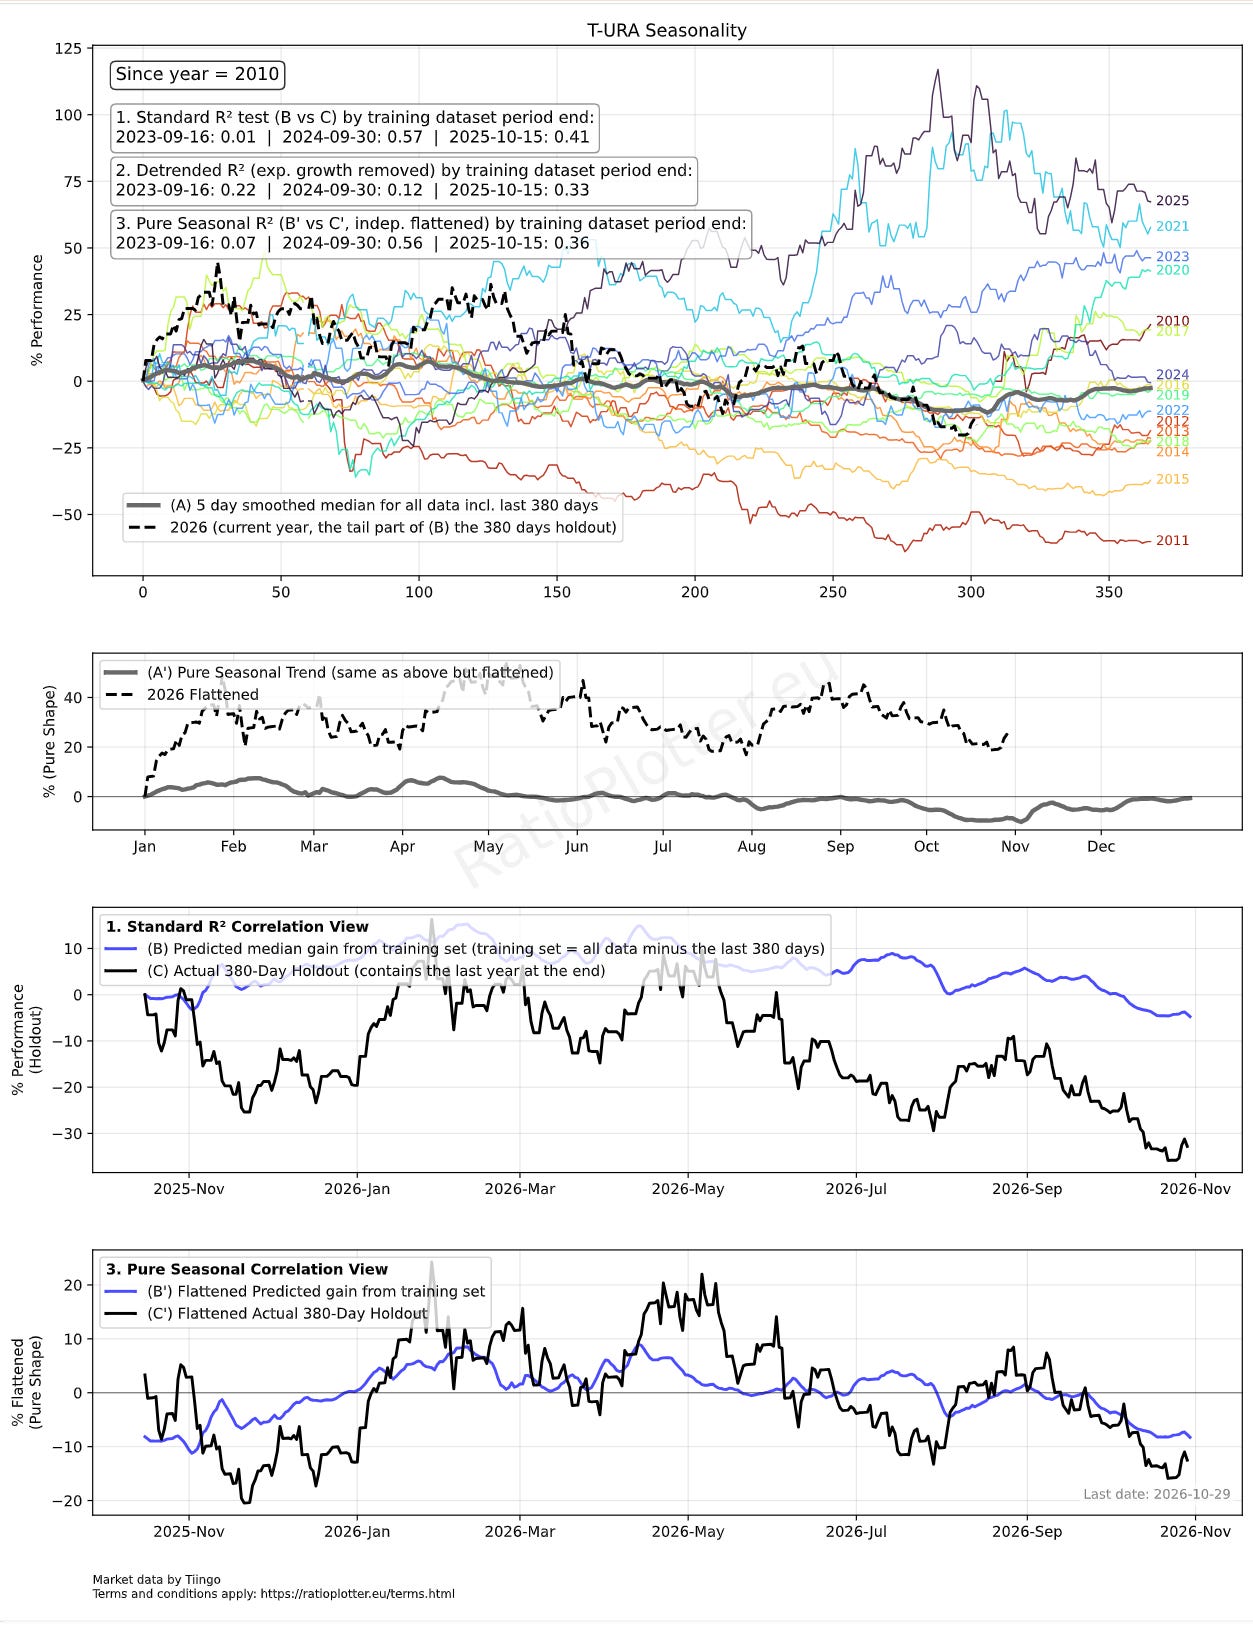
For those wanting to dive deeper, have a look at the seasonality of ticker URA which seems to dip steadily in September and raise with volatile swings up and down during October-February (we are referring to the last bottom pane blue trend curve). I can already tell you that the Iran war broke most seasonality trends this year for Oil, Gas, but when the previous seasonality trend for ticker URA coincides with the direction of movement for your price spread model, then it is worth taking it into account: