
Z scale (or standard deviations away from the mean) for the ratio of VT by world GDP. VT is the Vanguard Total World Stock ETF. We are using a version of this ticker that accounts for stock splits, but does not consider dividend reinvesting.
For decades, long-term investors have relied on macro-valuation metrics to gauge whether equities are trading at fair value, cheap, or in bubble territory. Among these, the classic Buffett Indicator—traditionally measured as total stock market capitalization relative to Gross Domestic Product (GDP)—serves as a supreme barometer of macroeconomic alignment. In theory, over long horizons, wealth cannot indefinitely outpace real economic output. Markets should fluctuate in a cyclical band around a stable mean.
Yet, looking at the global valuation landscape today, the chart tells a strikingly different story.
Deconstructing the Custom World Buffett Indicator
To capture a truly global perspective rather than focusing solely on U.S. equities, this analysis evaluates a modified, standardized view of global market value versus macroeconomic production.
- Why focus on the Global Buffett Indicator? Because it creates a more complete boundary than looking at a single country like the US, China, or even US+China. For example, if we only look at the US Buffett Indicator, we might see stock market appreciation driven by companies selling products that actually cause productivity gains elsewhere when applied. Elsewhere means globally, so why not use the Global Buffett Indicator, from which no tethering of stock market valuation to GDP can escape?
- The Numerator (Ticker VT): We utilize the Vanguard Total World Stock ETF (VT). To be specific the VT-SplitAdjClose which does not account for reinvested dividends, just the price of the world stocks. While VT does not represent 100% of the total capitalization of all private and public world companies (which would be required for a pure, traditional Buffett Indicator), it serves as a highly liquid, comprehensive proxy capturing broad global stock price movements.
- The Denominator (IMF World GDP): This is measured against the International Monetary Fund’s World GDP curve (IMF-NGDPD-WEOWORLD).
- The Z-Scale Transformation: Unlike the traditional Buffett Indicator—which is typically expressed as a raw percentage—this chart plots the Z_SCALE of the ratio:
Z_SCALE(RAT(T-VT-SplitAdjClose, IMF-NGDPD-WEOWORLD)) - By converting the data into a Z-score, we normalize the metric to show precisely how many standard deviations global stock valuations are currently sitting away from their historical mean. The RAT is simply a function to divide one time series by another, to take the ratio of two time series.
The Core Dilemma: A Structural Break or an Unsustainable Divergence?
If equities and macroeconomic output share a tethered gravity, a standard long-term valuation chart should oscillate horizontally within a predictable statistical band (e.g., between -2 and +2 standard deviations) as economic cycles roll through booms and recessions.
Instead, as visualized in the chart spanning from 2008 through late 2026, the trajectory looks alarming:
- The Post-Financial Crisis Recovery (2008–2012): Valuations bottomed out deeply below the mean (approaching -2 standard deviations), reflecting severe economic contraction followed by a cyclical reset.
- The Post-2016 Upward Shift: Rather than returning to a flat historical equilibrium, the moving averages (100MA and 200MA) have progressively tilted upward. Not even the 2020 Covid correction succeeded in bringing the system to a stationary regime, it made it cross the zero line one time, and then another time in 2022. In 2023 it barely touched the zero line to never cross it again until now.
- The Present Extreme (2025–2026): The ratio line has surged aggressively, breaking past +2 standard deviations above the historical mean.
This configuration raises a profound question for asset allocators and macro strategists: Why is the world Buffett indicator resembling a steep diagonal upward trajectory rather than a mean-reverting horizontal channel or stationary time series?
Where Will the Growth Come From?
Markets are forward-looking discounting mechanisms, meaning that a multi-standard-deviation departure above global GDP implies that investors are aggressively pricing in massive future expansions in productivity, corporate profitability, global integration, or technological revolutions (such as artificial intelligence and automation).
However, equity investors must confront a hard mathematical reality. If prices continue to outpace underlying global GDP growth at this steep angle, one of two things must eventually give:
- Real Global GDP must accelerate dramatically through generational productivity leaps to justify the lofty valuations baked into global equities.
- Global stock prices must undergo a mean-reverting correction or a prolonged period of consolidation to realign with actual macroeconomic output.
Let’s have a look at what is happening to the world’s GDP. Perhaps some of this expected AI growth is there already to be seen:
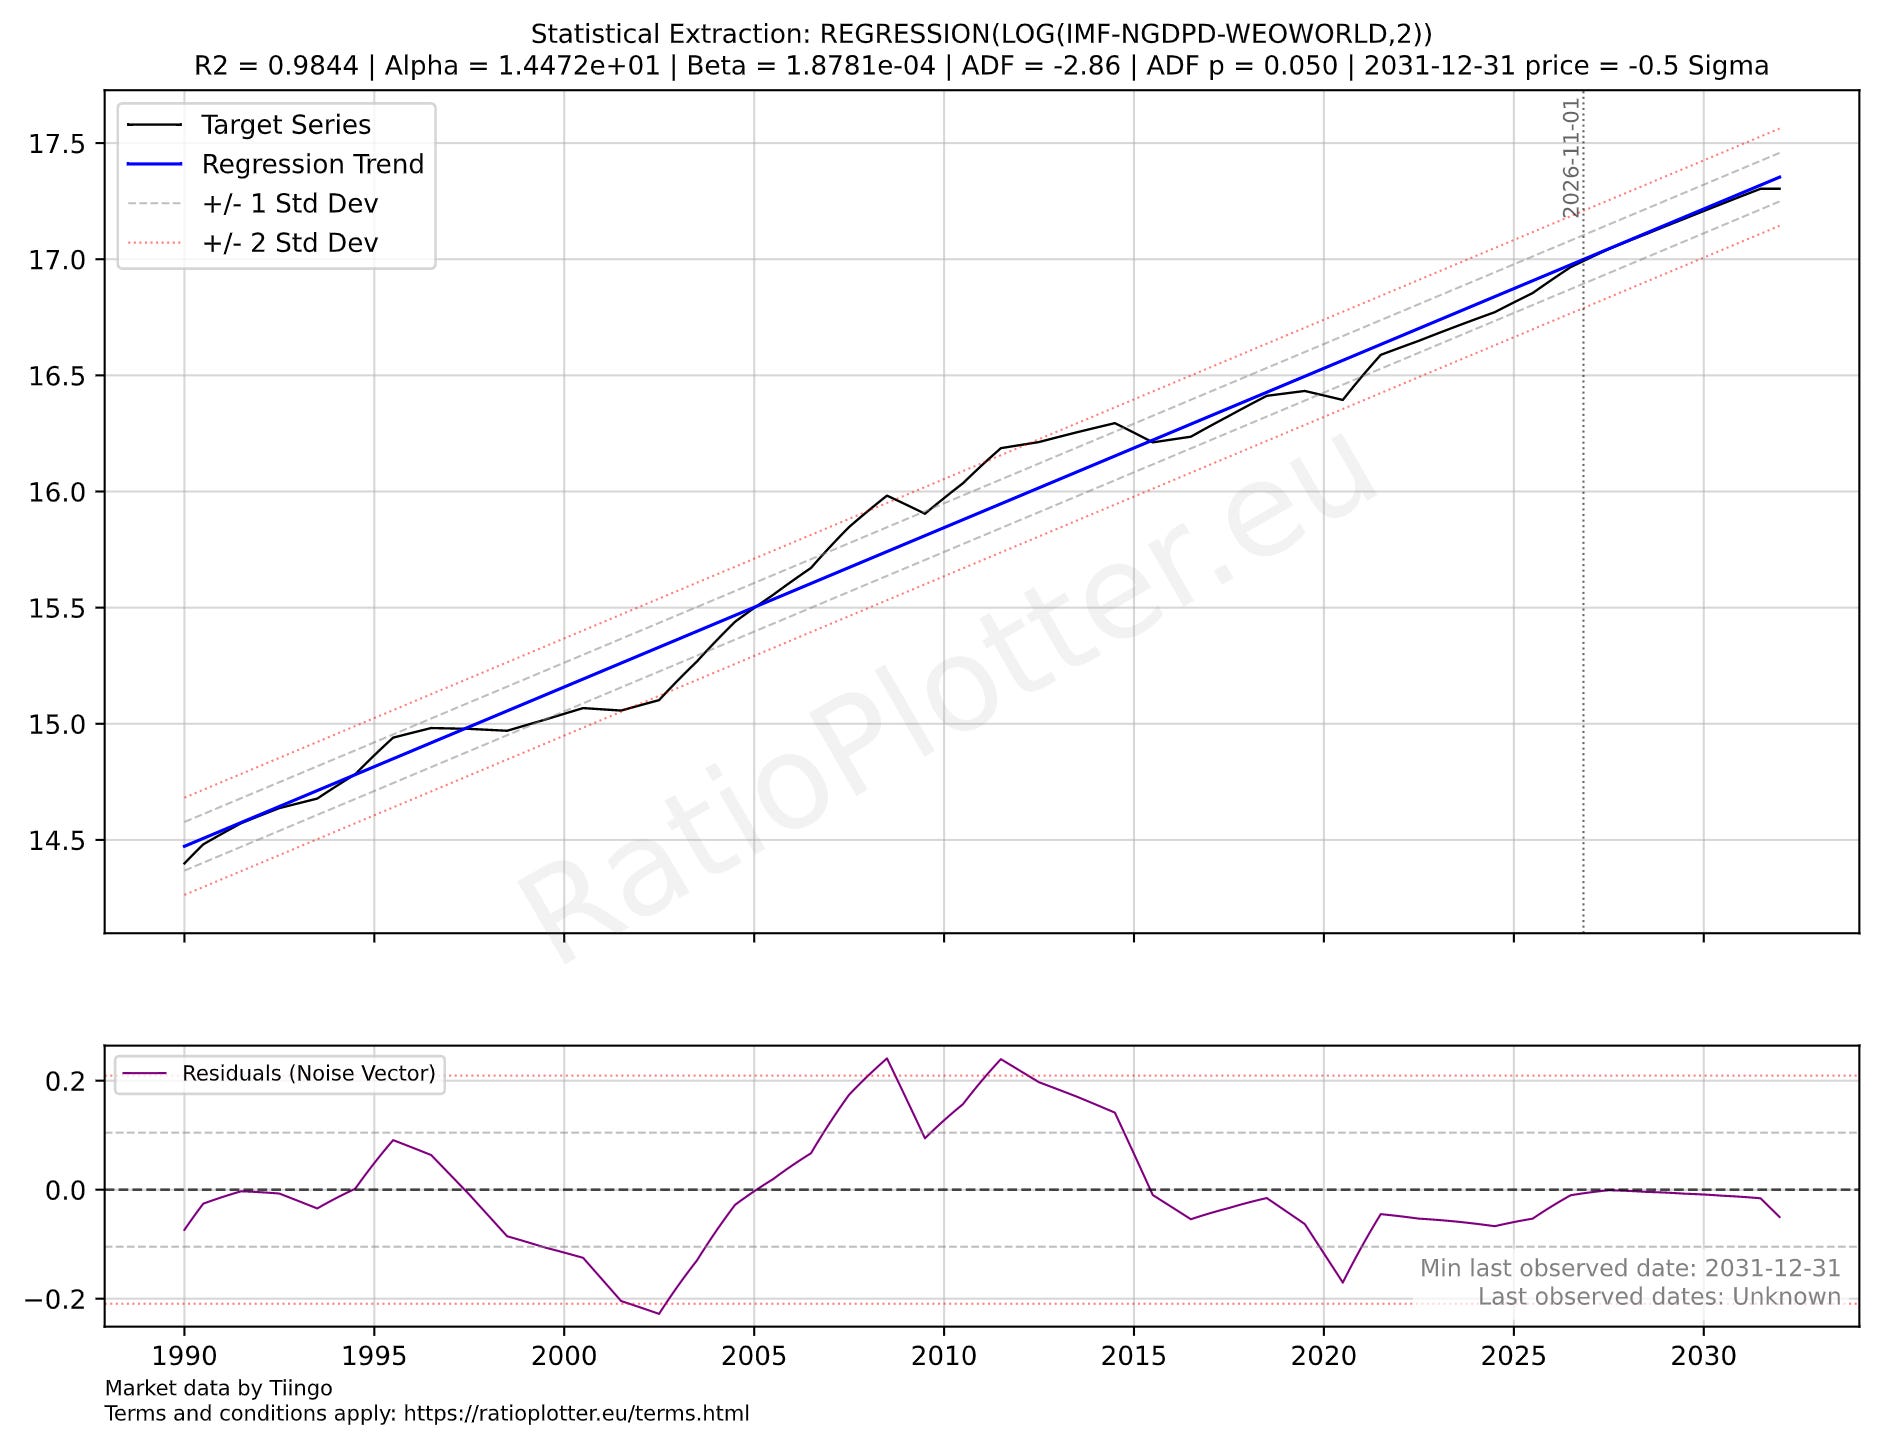
A linear regression model on the log of the IMF’s world GDP curve, with IMF estimates all the way to 2030.
The above chart is a linear regression model on the log of the IMF’s world GDP curve, with IMF estimates all the way to the year 2030. The log function transforms the exponential GDP growth into a curve with linear tendency. We see at the bottom pane, that during 2026, the world’s GDP is barely touching its average growth rate (the dashed line) and it approaches it from below. There is no extra growth now and there is no extra growth projected by the IMF. The world grew more from 2010 to 2015 than now (see the curve above the model blue average growth line). If anything environmentalists would argue we are reaching the limits of growth for the planet.
As we navigate an environment where global equities sit at historical extremes relative to IMF GDP metrics, the burden of proof rests heavily on the growth narrative. For investors paying current multiples, the critical gamble is whether the global economy can deliver an unprecedented economic engine to justify the slope of that line. Can anybody show some data to back the growth narrative behind these prices? I can’t.