I had already written a note and an article on how some fertilizer companies were at bargain prices, since then that particular company has gone up quite a bit. This time I want to talk about corn prices.
If you are a visual thinker like me then you probably appreciate that I start with this chart right away:
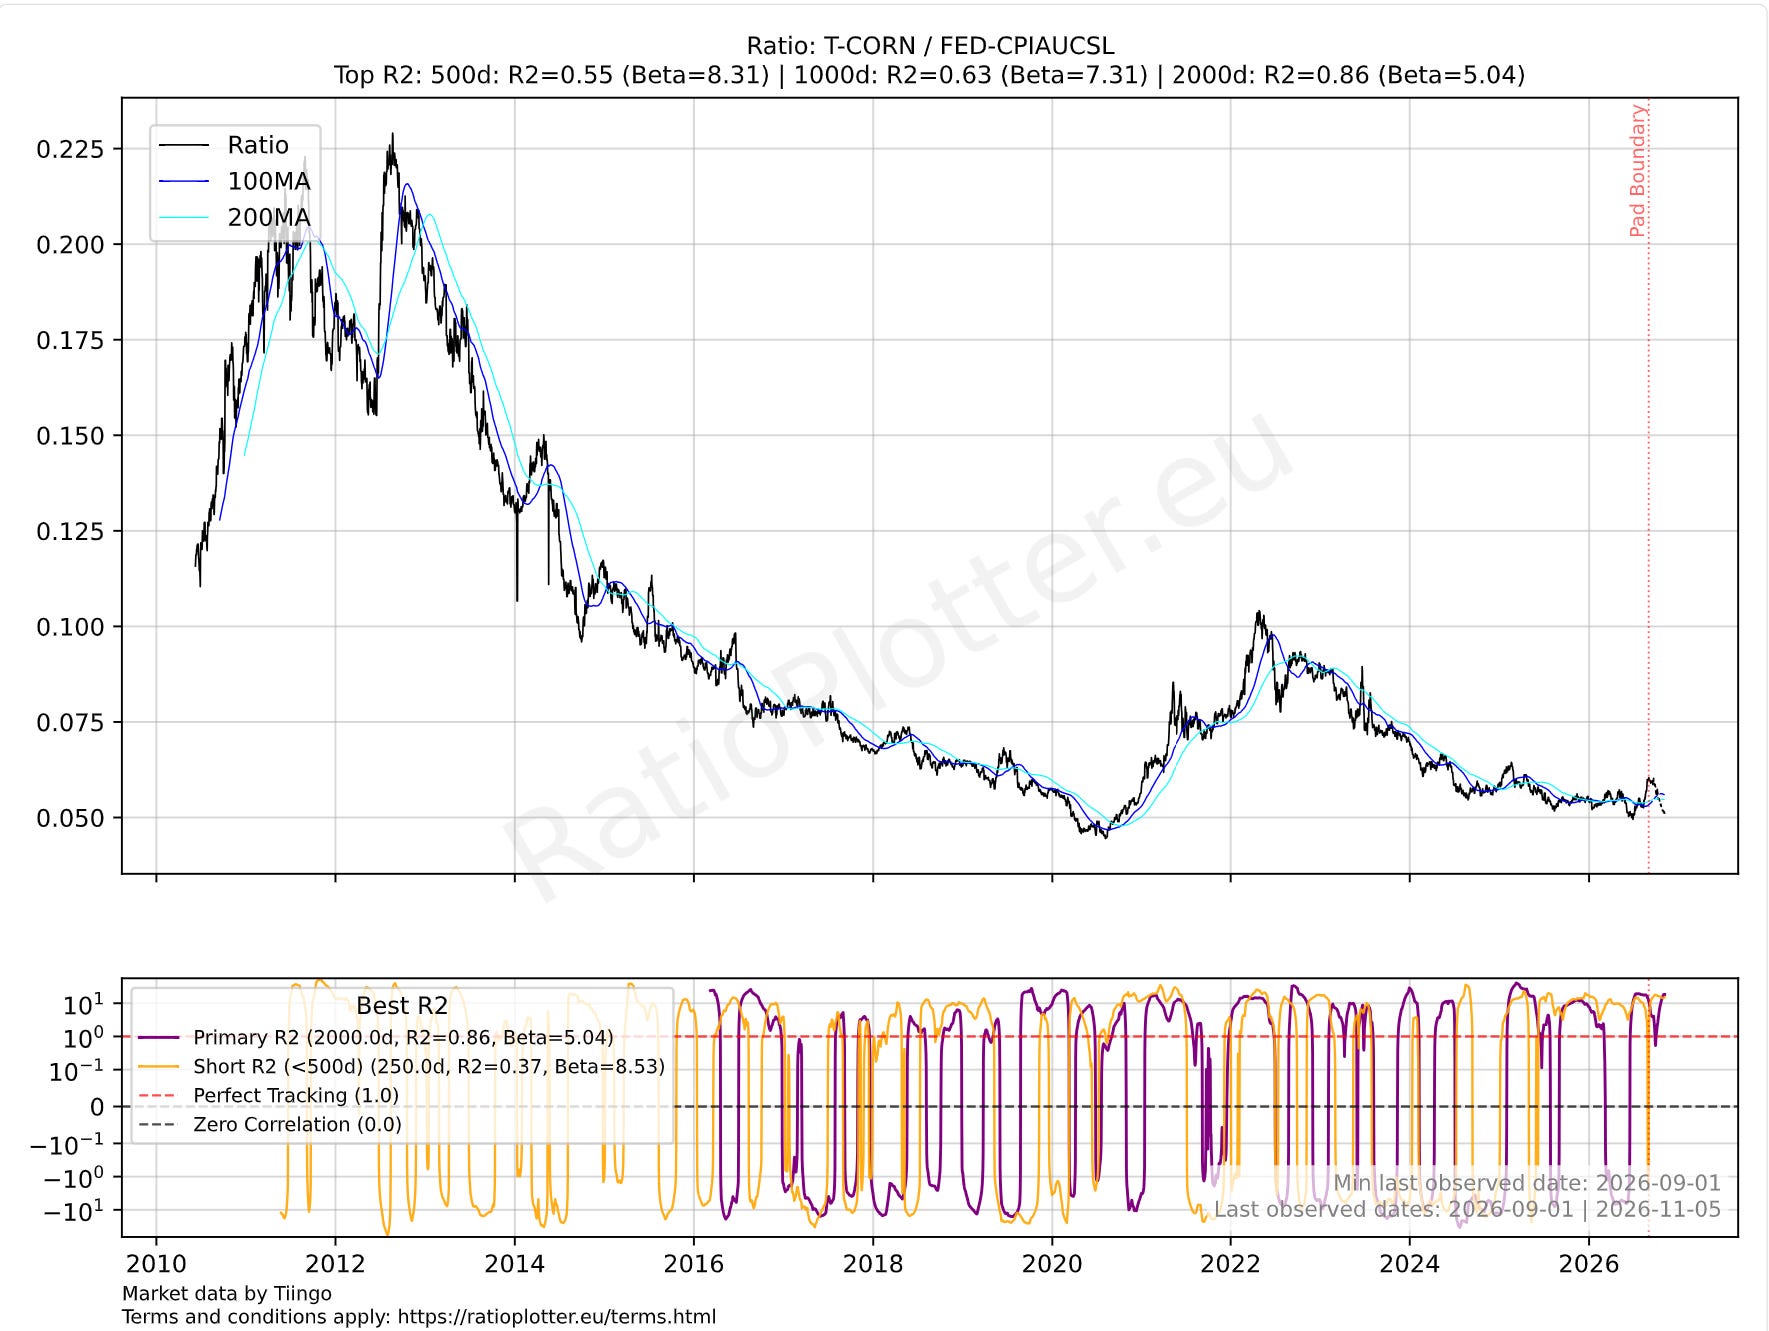
November 2026 inflation-adjusted prices for ticker CORN: the Teucrium Corn Fund. The chart shows the price of ticker CORN divided by the Fed’s CPI, the Consumer Price Index for All Urban Consumers. The All Items (CPIAUCSL) is a price index of a basket of goods and services paid by urban consumers.
After analyzing the above chart, are you asking the same question as I am? Where is the inflation from higher fuel prices, and higher fertilizer prices in corn? Corn is down since the Iran war started in January 2026, there is no visible war inflation in corn prices. The transmission mechanism for inflation has not impacted corn prices yet, or if it has impacted them, it is just keeping corn from sinking even more.
Why are corn prices low? That is probably the next best question to ask. Yes, it is always good to reality-check such extreme values. Answering why corn is cheap would take another full article, but to satisfy our needs here it suffices to say that corn is selling below the average farmer’s production cost. Only about 10% of farmers can sell it at a profit at the current prices. I’d say the main reason for the low prices is the super-harvest in the US, and of course the delay that it takes for inflation to transmit, about 500 days as per another article I wrote on substack: https://substack.com/@ratioplottereu/note/c-339422802
Hedge funds are buying corn right now, but they won’t tell you why. I am not in the hedge fund business, nor in the business of speculating or providing financial advice, my sole goal is econometrics, understanding relationships between these assets through models and building ever better modelling tools with more and more data for your usage.
The above shows that corn is cheap in inflation-adjusted US dollars. The sensible follow-up question is: how about other agricultural commodities, are they also cheap or cheaper?
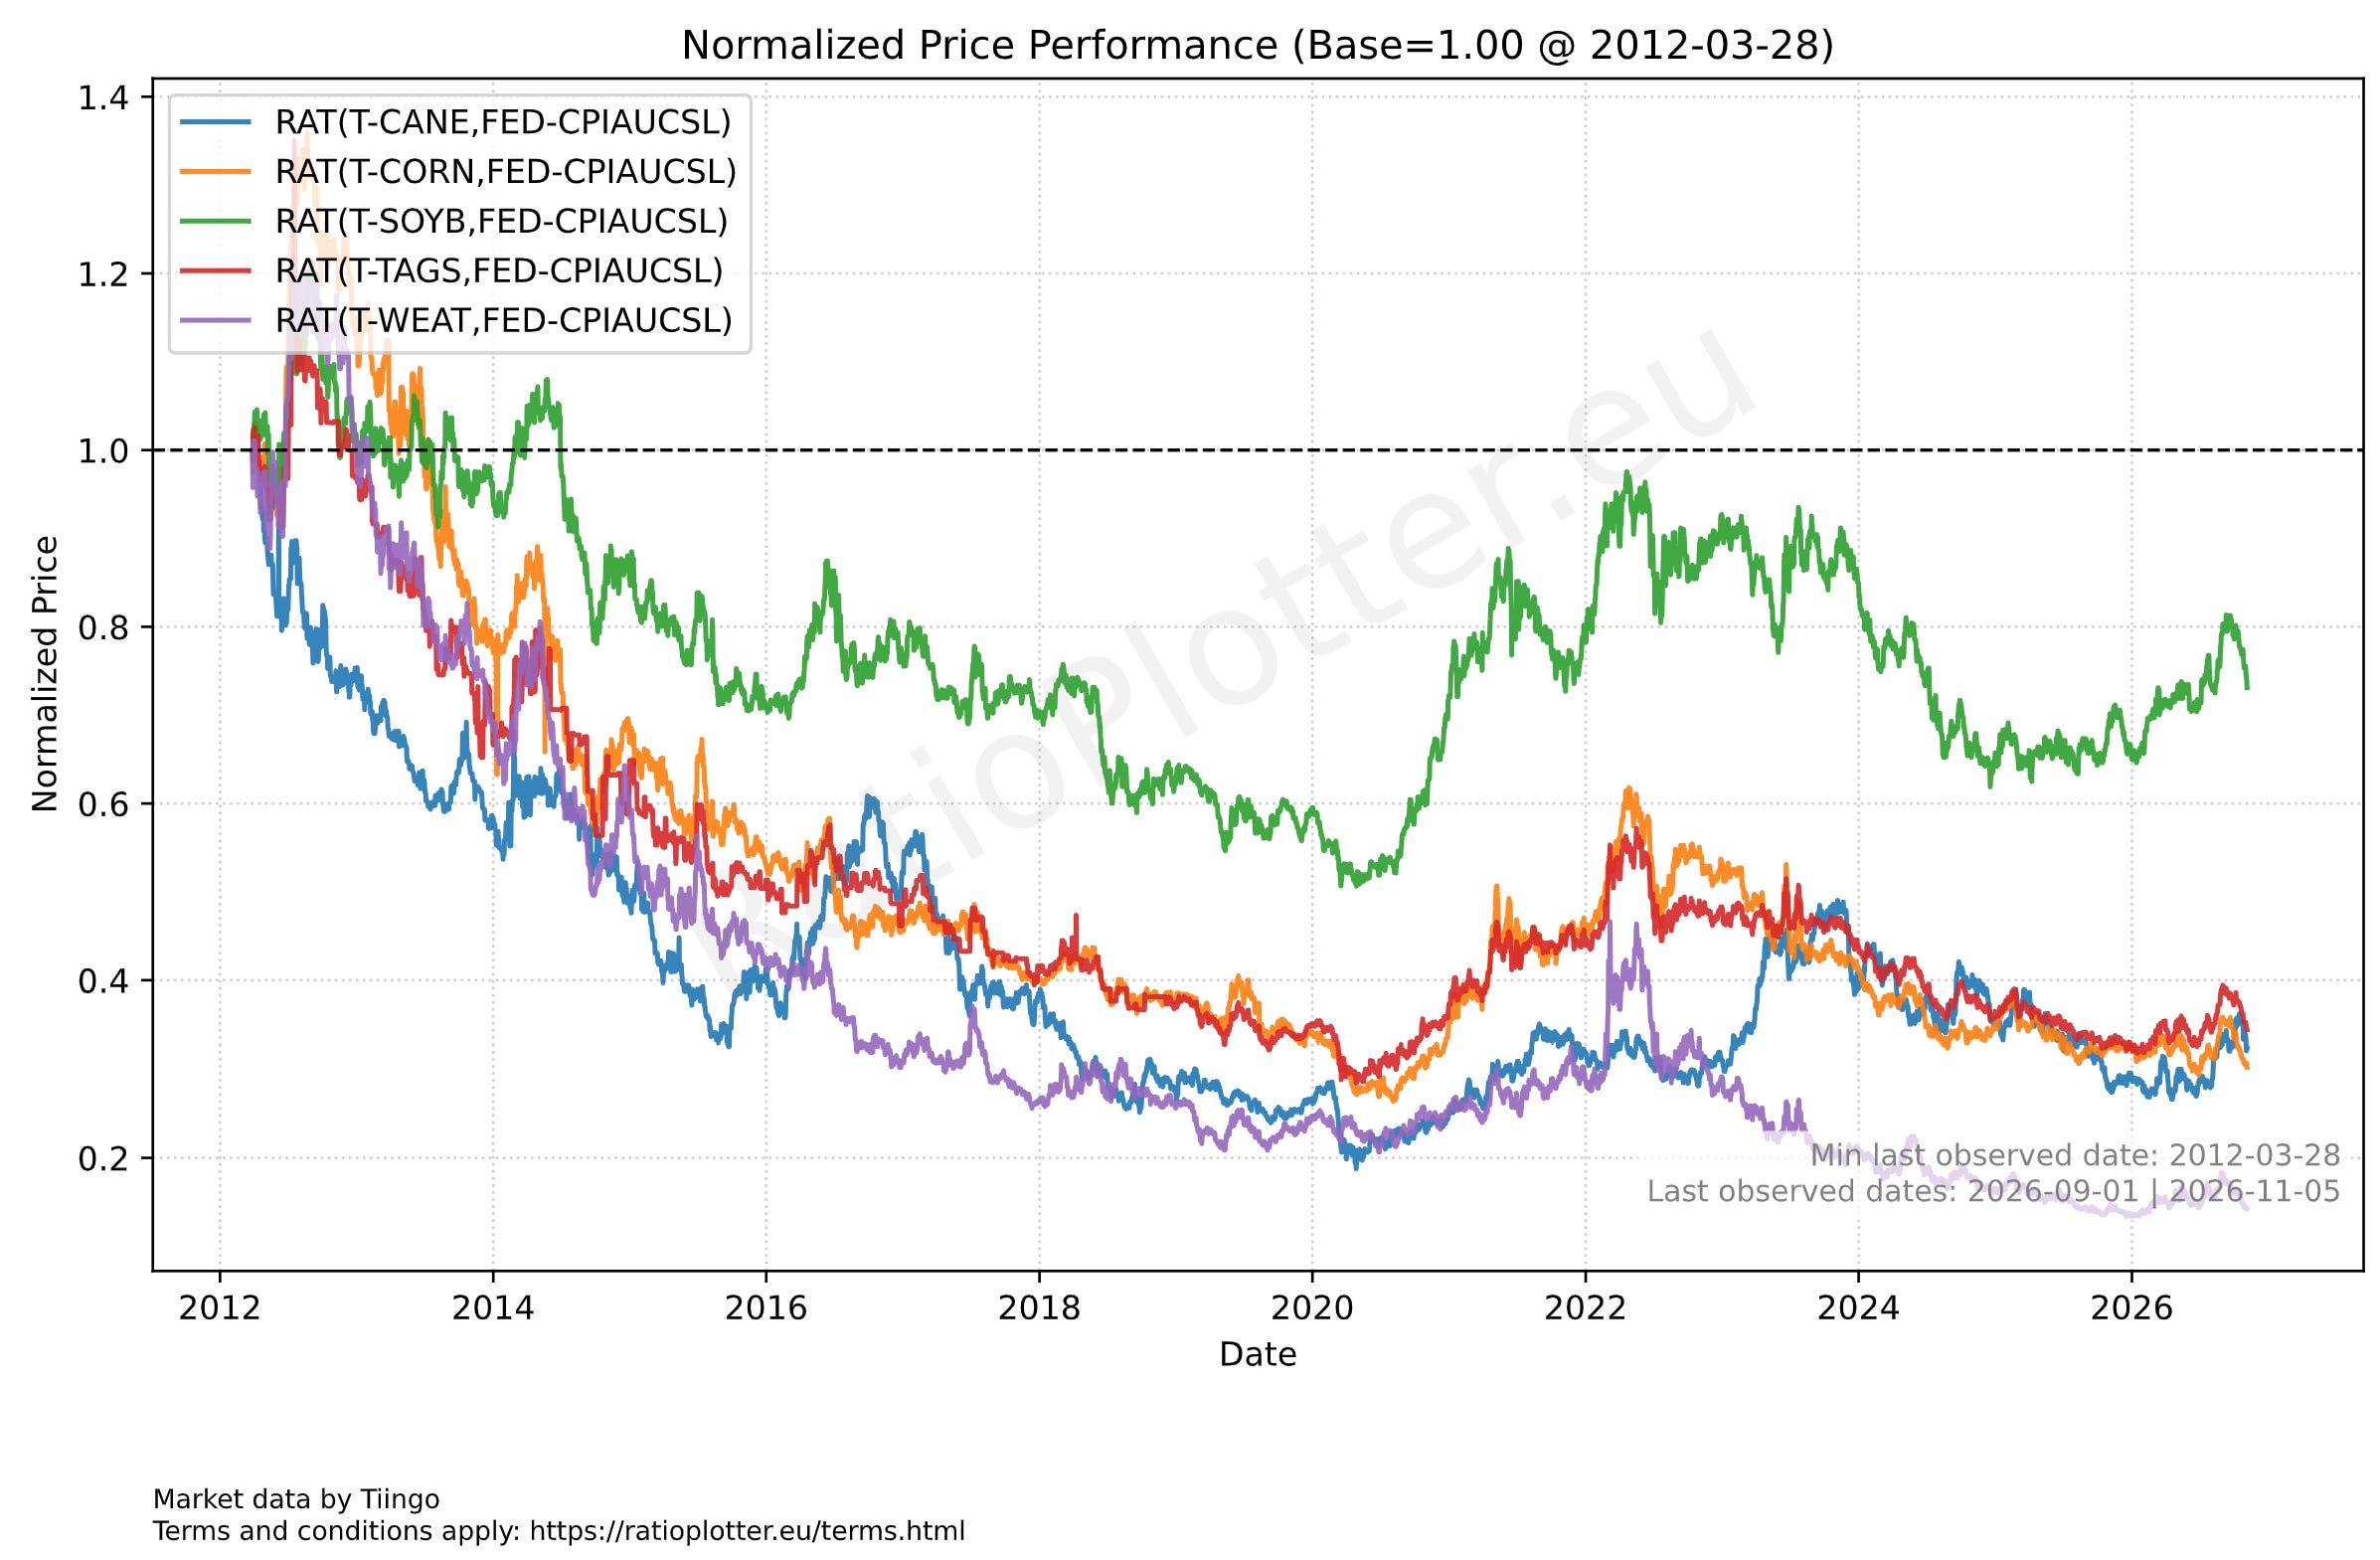
Normalized (starting at 1) inflation-adjusted prices for Corn, Wheat, Sugar, and ticker TAGS (Composite Basket of CORN, WEAT, SOYB, CANE).
Explaining the tickers in the chart: Ticker WEAT is the Teucrium Wheat Fund. Ticker SOYB is the Teucrium Soybean Fund. Ticker CANE is the Teucrium Sugar Fund. Ticker CORN is, as we have stated, the Teucrium Corn Fund. And ticker TAGS was explained above as a composite basket of CORN, WEAT, SOYB, and CANE.
Let’s break down the above chart analysis by time period:
- The current calendar year: the first thing I notice is that corn is the only one that is down since the Iran war started in January 2026. That is not something most people would quickly notice, but it is important, since this war is a major force. Also good analysts have an eye for asymmetry. Corn is down since January, while all others are up, that is asymmetric for agricultural commodities.
- The whole time range since 2012: in the long run wheat seems to have gone down more than corn. But hold your horses on wheat being the most extreme. Overlay charts are remarkably biased by their start-date spread, the spread of a single day can spoil the whole absolute drag-down conclusion, even after decades of price movements.
- Even longer time scales than the chart: the last thing I notice is that they are all lower then their price in 2012, this is not a surprise at all, corn now costs about half of what it used to cost to produce in the 1970s when adjusting for inflation (FDA data). This secular downtrend in grain prices is great for fighting world hunger. The cause is mainly the advances in agricultural science, and economies of scale.
How much can these prices bounce up? Looking at the chart, it is not unusual to see prices double or go up 50% in one year before resuming the overall downtrend due to production efficiency gains. Right now corn is below the average farmer’s production cost, so it is depending on production cost improvements to continue the downtrend. In the meantime, it has the Iran war inflation percolation acting as a potential future price booster.
If after the above chart you feel tempted to double-check how cheap wheat is in relation to corn, then your thinking process matches mine closely. It is always good to double-check something being the cheapest on an overlay chart, especially because overlay charts like the one above are known to be very sensitive to the price spread on the start date of the chart, as opposed to the average price spread between two assets during the whole range plotted. If on that start date wheat was a bit more expensive than usual relative to corn, the whole chart will develop a bias to show wheat as dropping more in price than it really did in terms of relative price to corn. To answer how wheat is priced relatively to corn with more accuracy, I plot this regression analysis below:
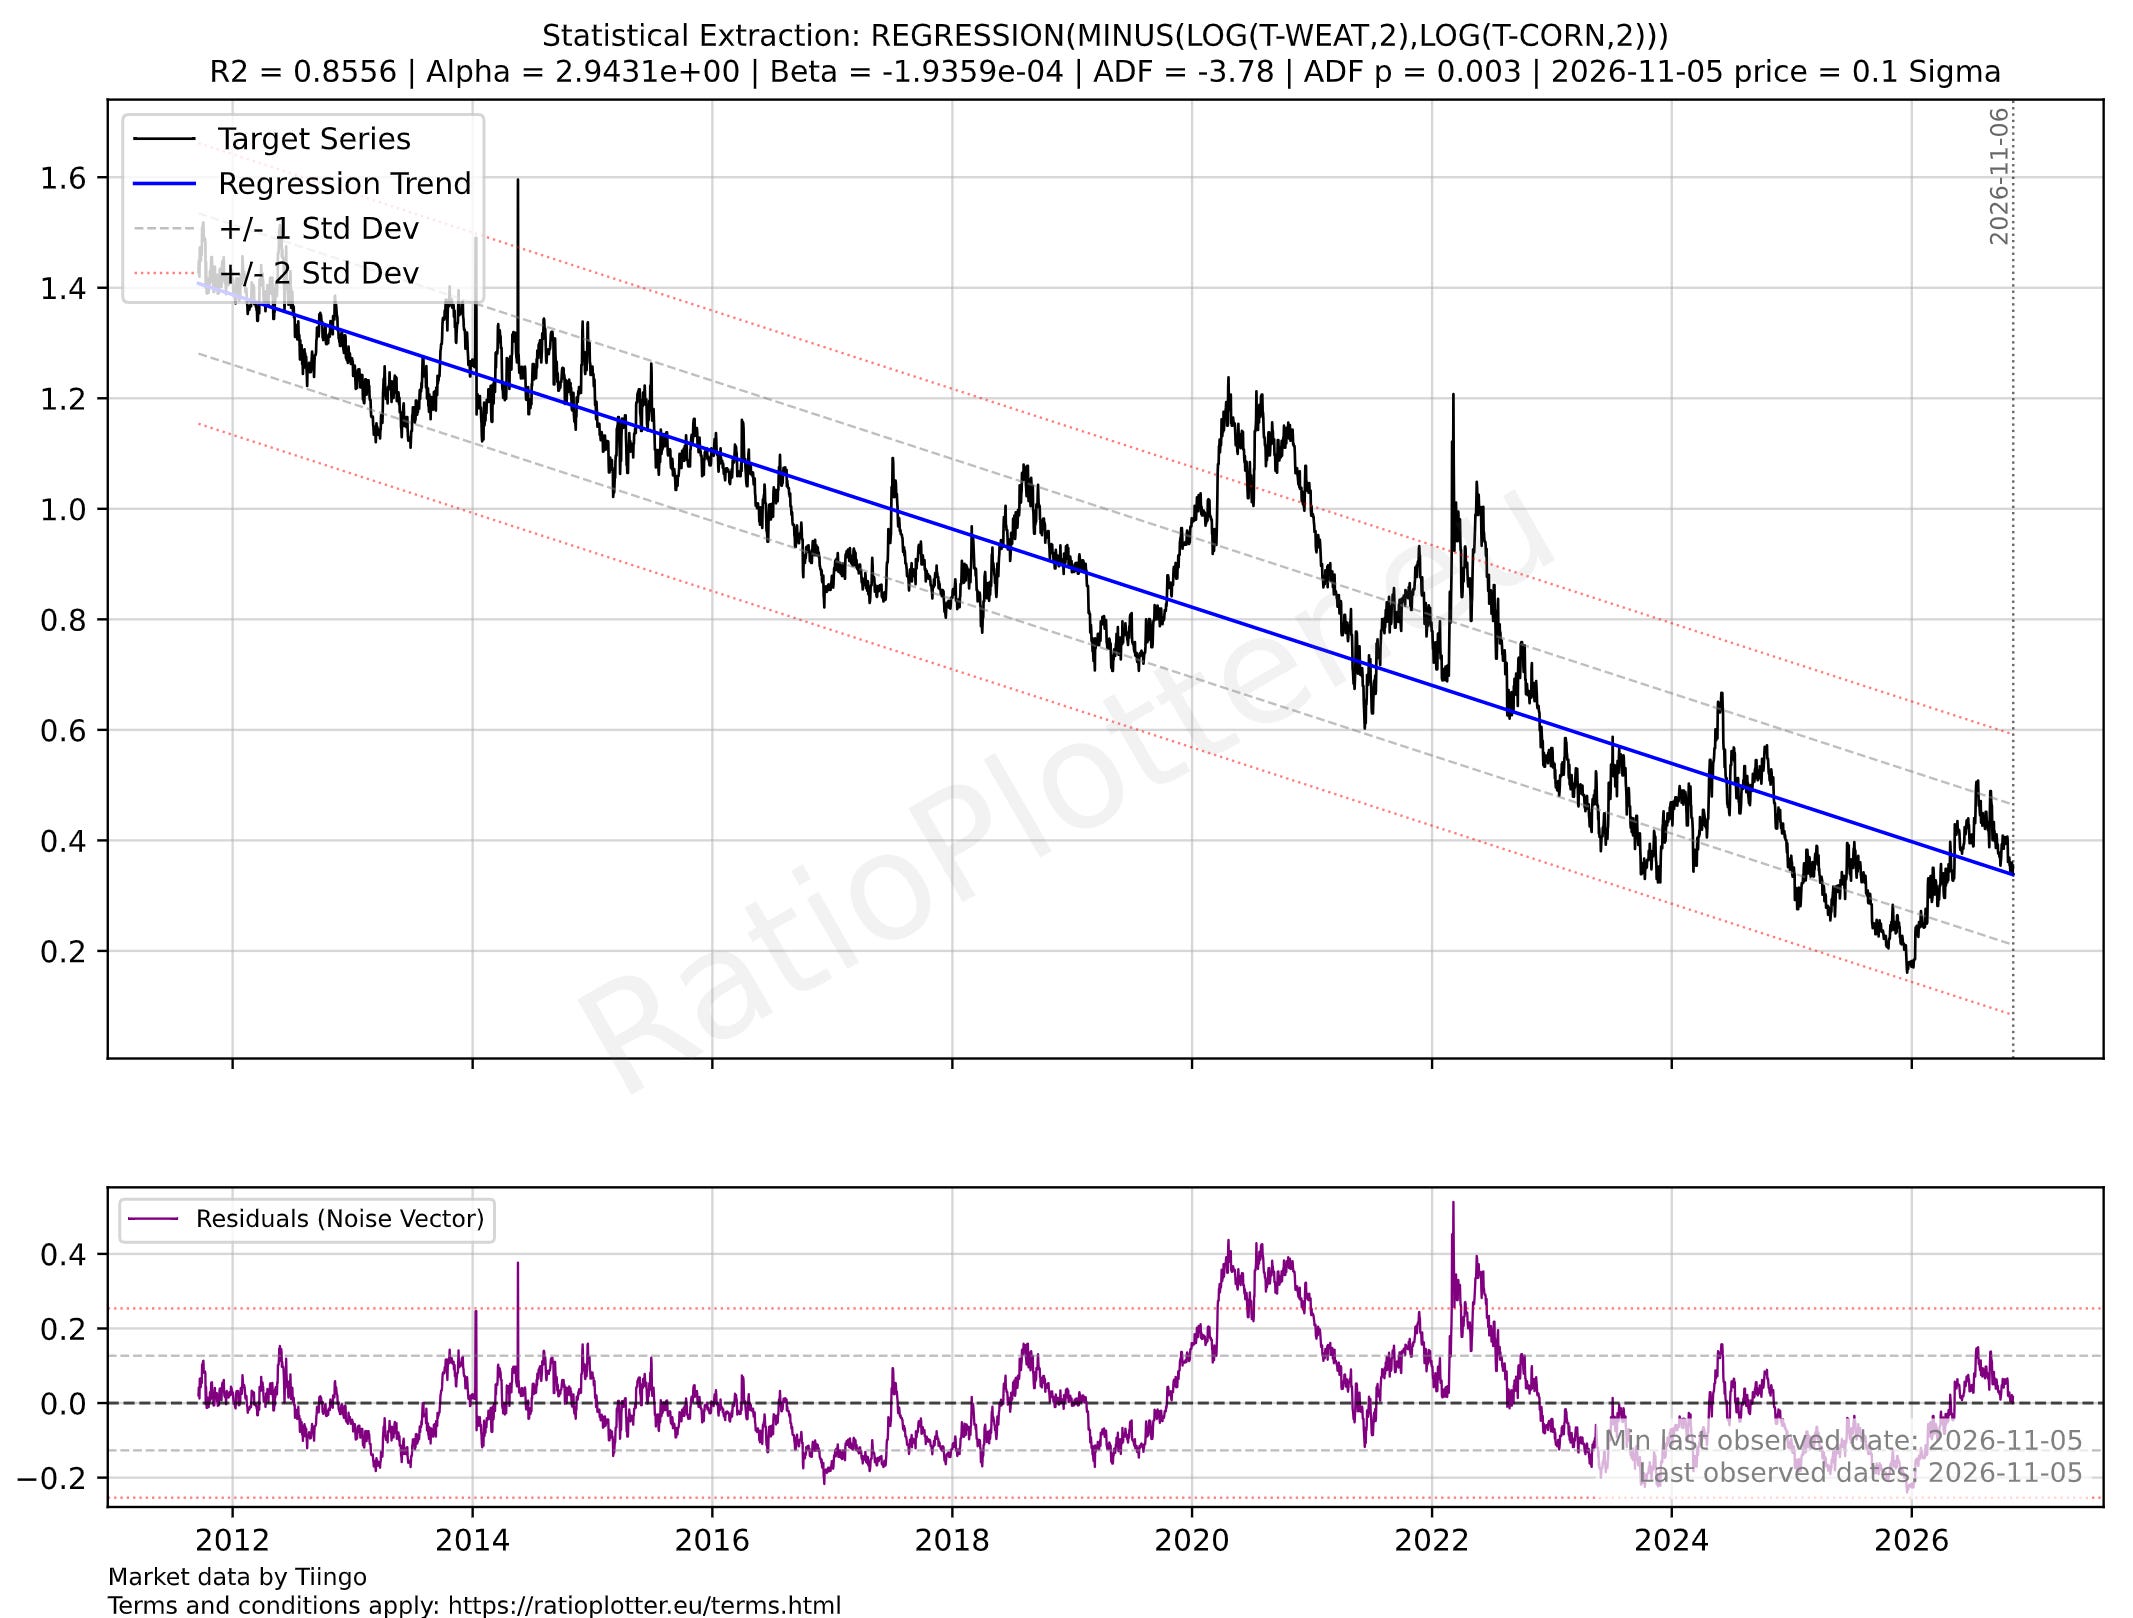
Constrained ratio spread between wheat and corn prices. The log function is applied to facilitate the linear modeling of exponentially growing or decaying prices.
The regression analysis is of outstanding statistical quality (correlation, mean reversion, etc). This is not surprising given that the two are very similar commodities. What could have spoiled the predictability of the spread are irregular trends for instance in planted acreage. These acreages are changing, but in a regular, predictable pattern when it comes to their effect on the prices. Likewise for the impacts of technological advances.
The first thing you notice after checking the quality figures (correlation, stationarity) is that the beta is negative. Meaning the spread is going down, becoming smaller, which means wheat gets cheaper at a faster rate than corn, even though the world acreage is mostly flat for wheat and increasing for corn (perhaps just a matter of preference on what to plant and consumer demand).
If anything, wheat is 0.1 sigma (a tiny inch) more expensive than usual against corn and we see that the wheat-to-corn spread tends to narrow (negative beta), which means corn will likely have much higher upward movements in price.
Last, but not least, what is happening to SOYB and what is the relationship of SOYB to CORN and to the Iran war? Soybeans are a legume, that means they naturally fertilize the soil with nitrogen! Farmers use soybeans with corn in crop-rotation fashion to allow the soybeans to fixate the nitrogen in the soil that will later be consumed by the corn crop. After planting soybeans the nitrogen available in the soil is high, and the new crop-rotation cycle with corn will need more fertilization for phosphate and potash than for nitrogen. That saves on fertilizer costs, which is smart during an Iran war that is raising fertilizer costs, especially nitrogen fertilizer costs.
Now we come to the perfect storm.
Look at the trend of fertilizer application in the US on the y-axis, going unfortunately only to 2024 (World Bank data):
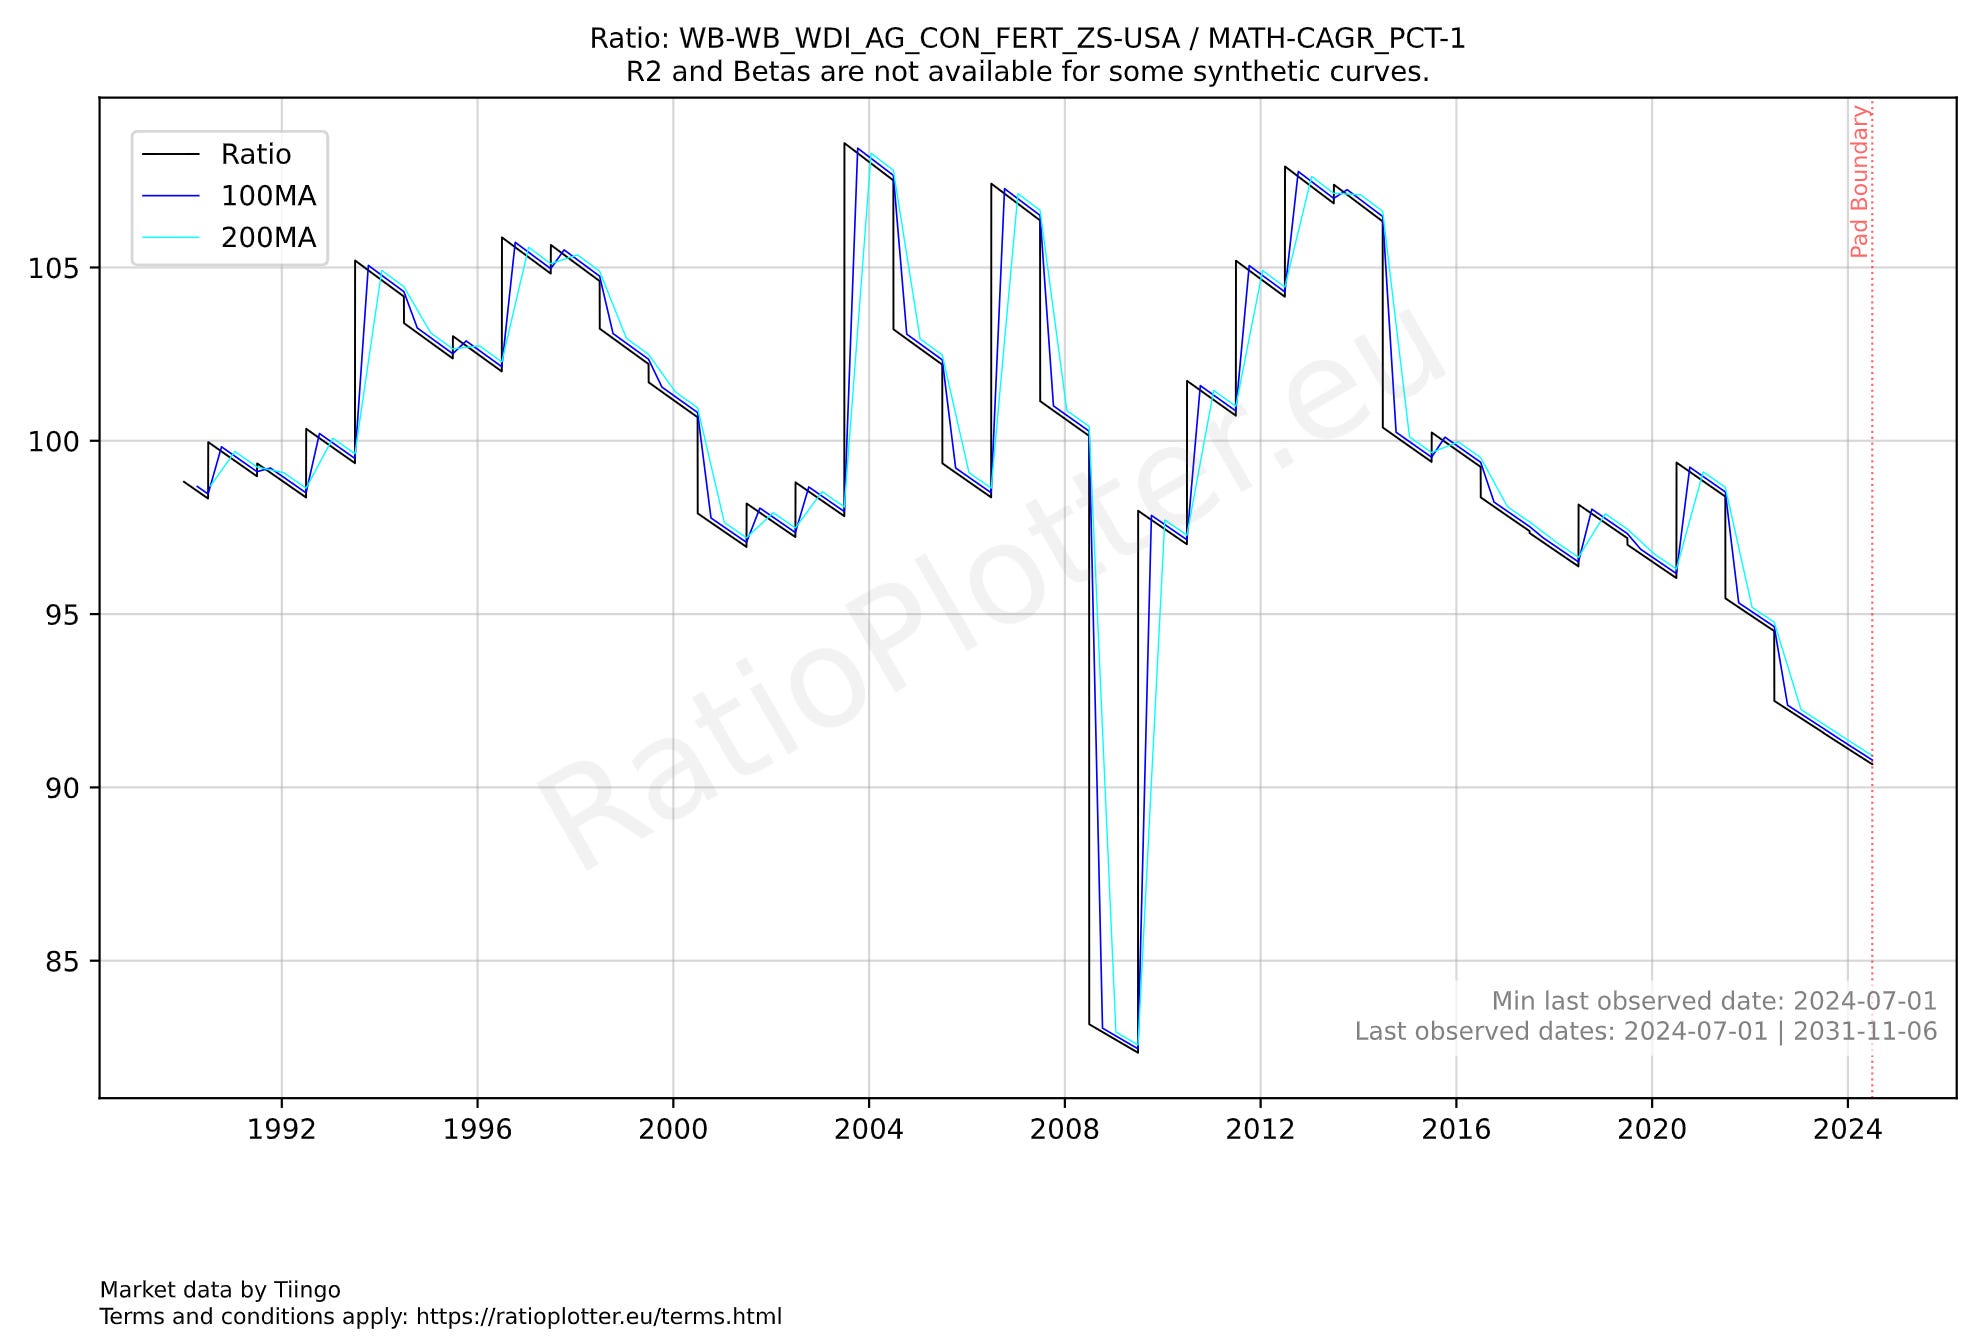
If anything, the US farmers are fertilizing less and less. Yet the US agricultural production continues to rise. This means we are not starting from a situation of a heavily over-fertilized soil.
Then we have a very expensive soybean price in relation to corn and wheat. This means there is not an abundance of soybeans that fertilized the soil. And fertilizer prices are already high due to the Iran war. Urea (base for nitrogen fertilizer) prices for instance went from about $386 in January before the war to a range around $450 recently.
Now I ask the following question to the farmer in you: what would you plant in the next crop-rotation cycle if soybeans are expensive relative to corn and wheat, if wheat is not fetching the best price, and if soybeans require less nitrogen fertilizer and will help the next crops also require less nitrogen fertilization? If your answer is soybeans then you are following the process.
If most farmers worldwide plant more soybeans than usual in the upcoming crop rotations, what will happen to the price of corn? It will tend to go up right?
Now the final blow-off chart, which tries to capture the crop rotation effects in the prices of corn and soybeans:
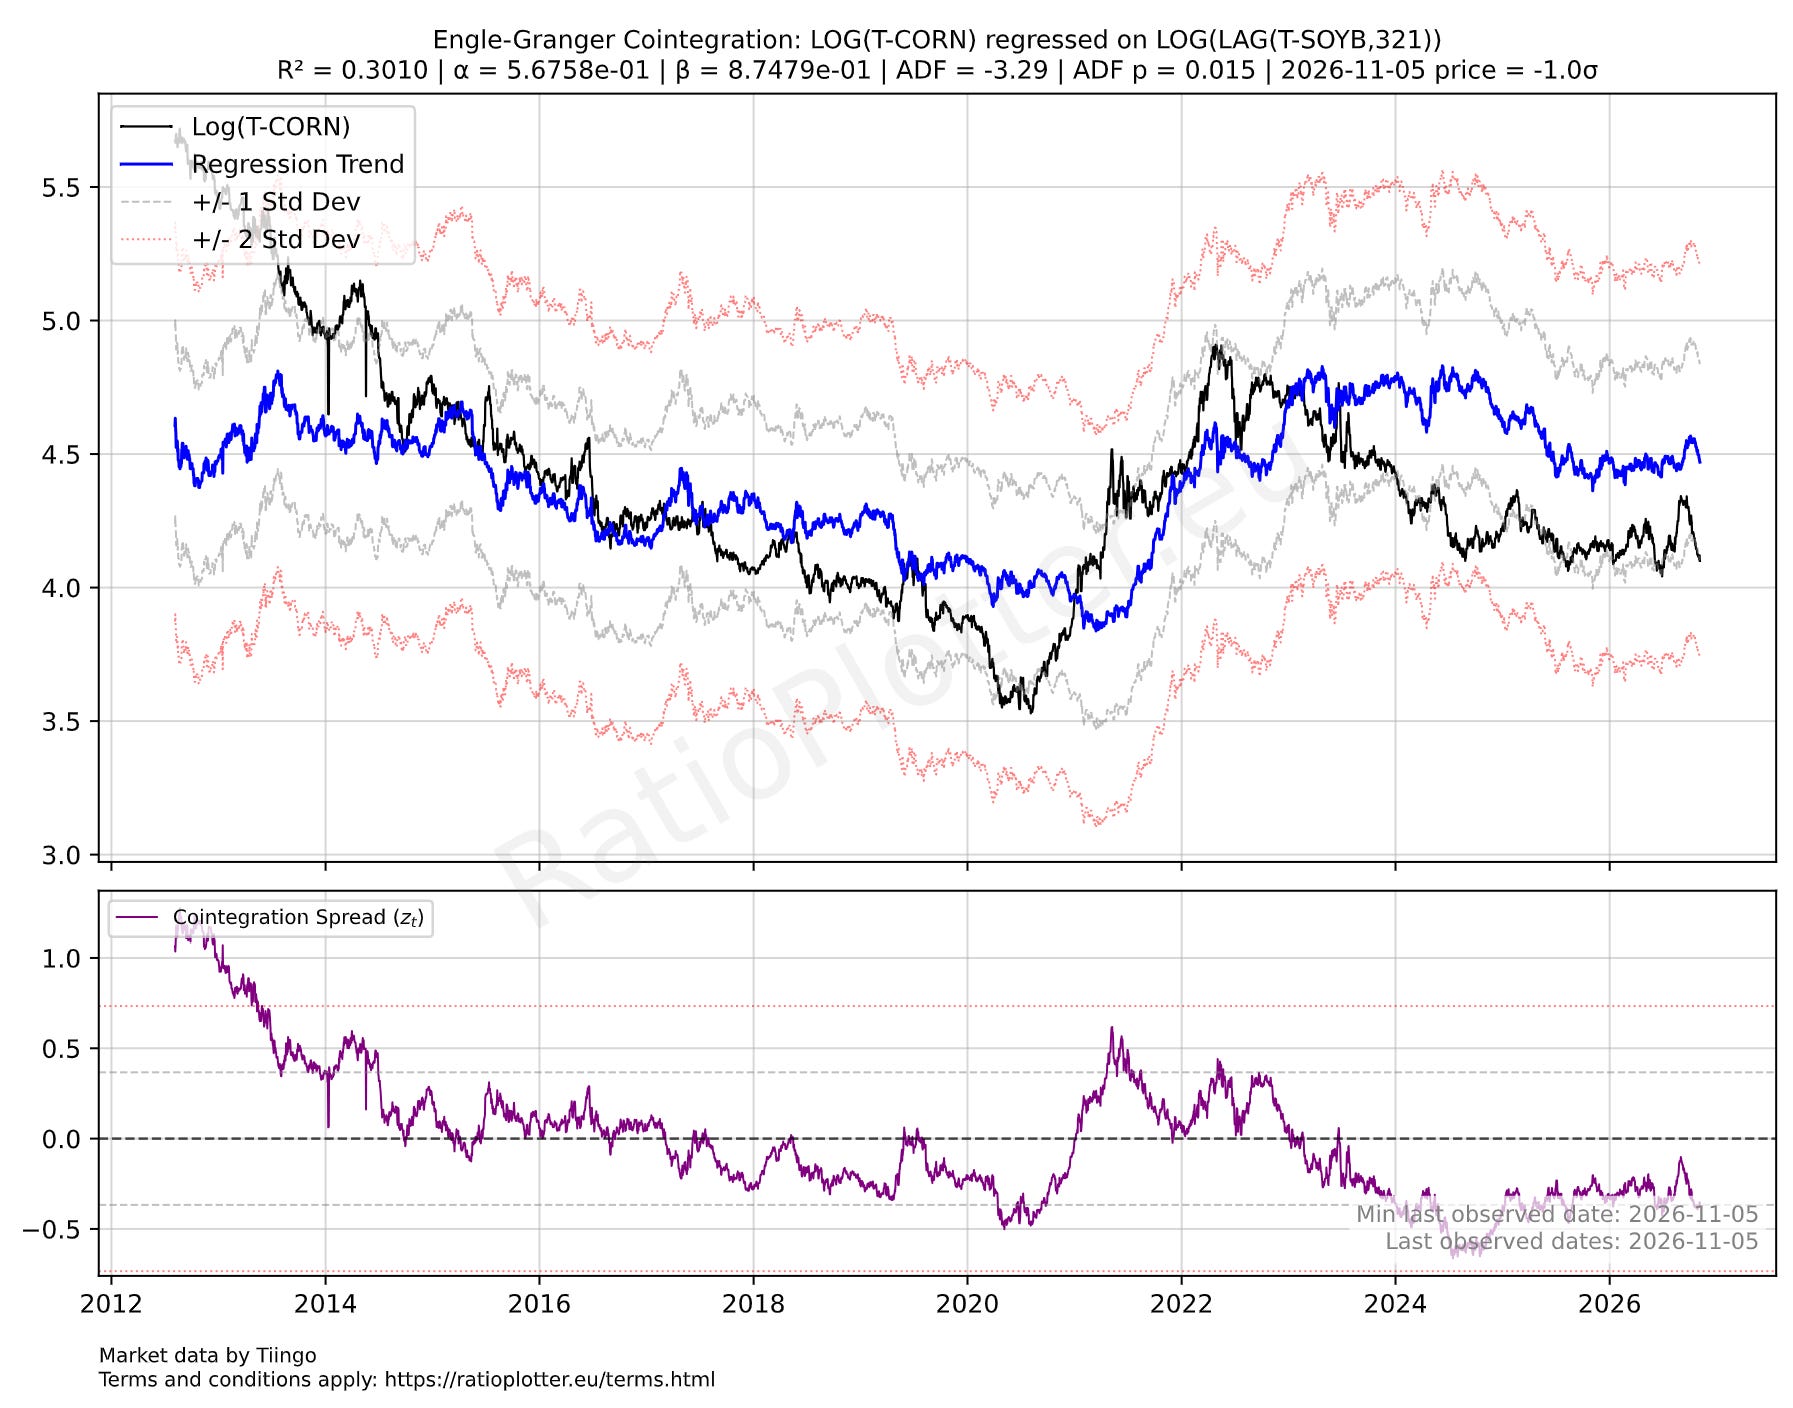
The above chart uses the price of soybeans 321 days ago (lag of 321 days applied to the time series) to predict the prices of corn now. Basically corn is -1 standard deviation below what it should normally be in relation to soybean prices 321 days ago. The 321 days is chosen by trial and error, optimization search if you wish for the value that maximizes the model quality statistics such as correlation and stationarity.
The stationarity statistics (ADF p-value) are excellent meaning this model for the lagged price spread is very likely to revert to the mean, which really puts the weight on corn going up since we cannot change soybean prices 321 days ago. I hope you understand that the mechanism behind this price relationship is the crop-rotation cycles, the nitrogen fixation by soybeans, and the farmer’s intentions to plant more of one crop than the other to optimize their profits and costs. Since farmers will optimize costs by planting more soybeans, and since farmers will avoid corn that is cheap and below production costs we have a situation that is well-known in commodity trading: low prices beget high prices through the supply and demand oscillation mechanisms. Or sometimes it is said that the cure for low prices is high prices.
The farmer’s planting intentions from March 3rd where already going in the above direction: the US Farmers intended to plant 95.3 million acres of corn (down 3% year-over-year) and 84.7 million acres of soybeans (up 4% year-over-year) for the 2026 planting season, according to the USDA’s Prospective Plantings Report.[cite: 1] The economics factors analyzed here seem to indicate these planting intentions will only have intensified since March.[cite: 1] Unfortunately, the Prospective Plantings report is released annually, so you will have to wait for the data or the facts.[cite: 1] Based on the above, our expectation is for more soybeans and fewer corn acres to be planted and for the prices to move according to this shift in supply.[cite: 1]
Final disclaimer: reading this article does not create an advisory relationship. The material provided here is for educational purposes on econometrics and does not constitute financial advice.