I got somewhat inspired by reading the excellent article by Robin J. Brooks entitled: “Everything Is An Oil Trade (In The Last Months)”:
Looking at Robin J Brooks data, I decided to test whether oil and market volatility would coincide for this year, and bingo, for the period since the start of the Iran war (Jan 2026) the volatility curves of Brent Oil (ticker: BNO) and the MSCI World (ticker: URTH) have almost the exact same shapes with peaks and troughs. This seems to confirm Robin’s thesis, the market is indeed moving with oil shake-ups this year (since the Iran war started).
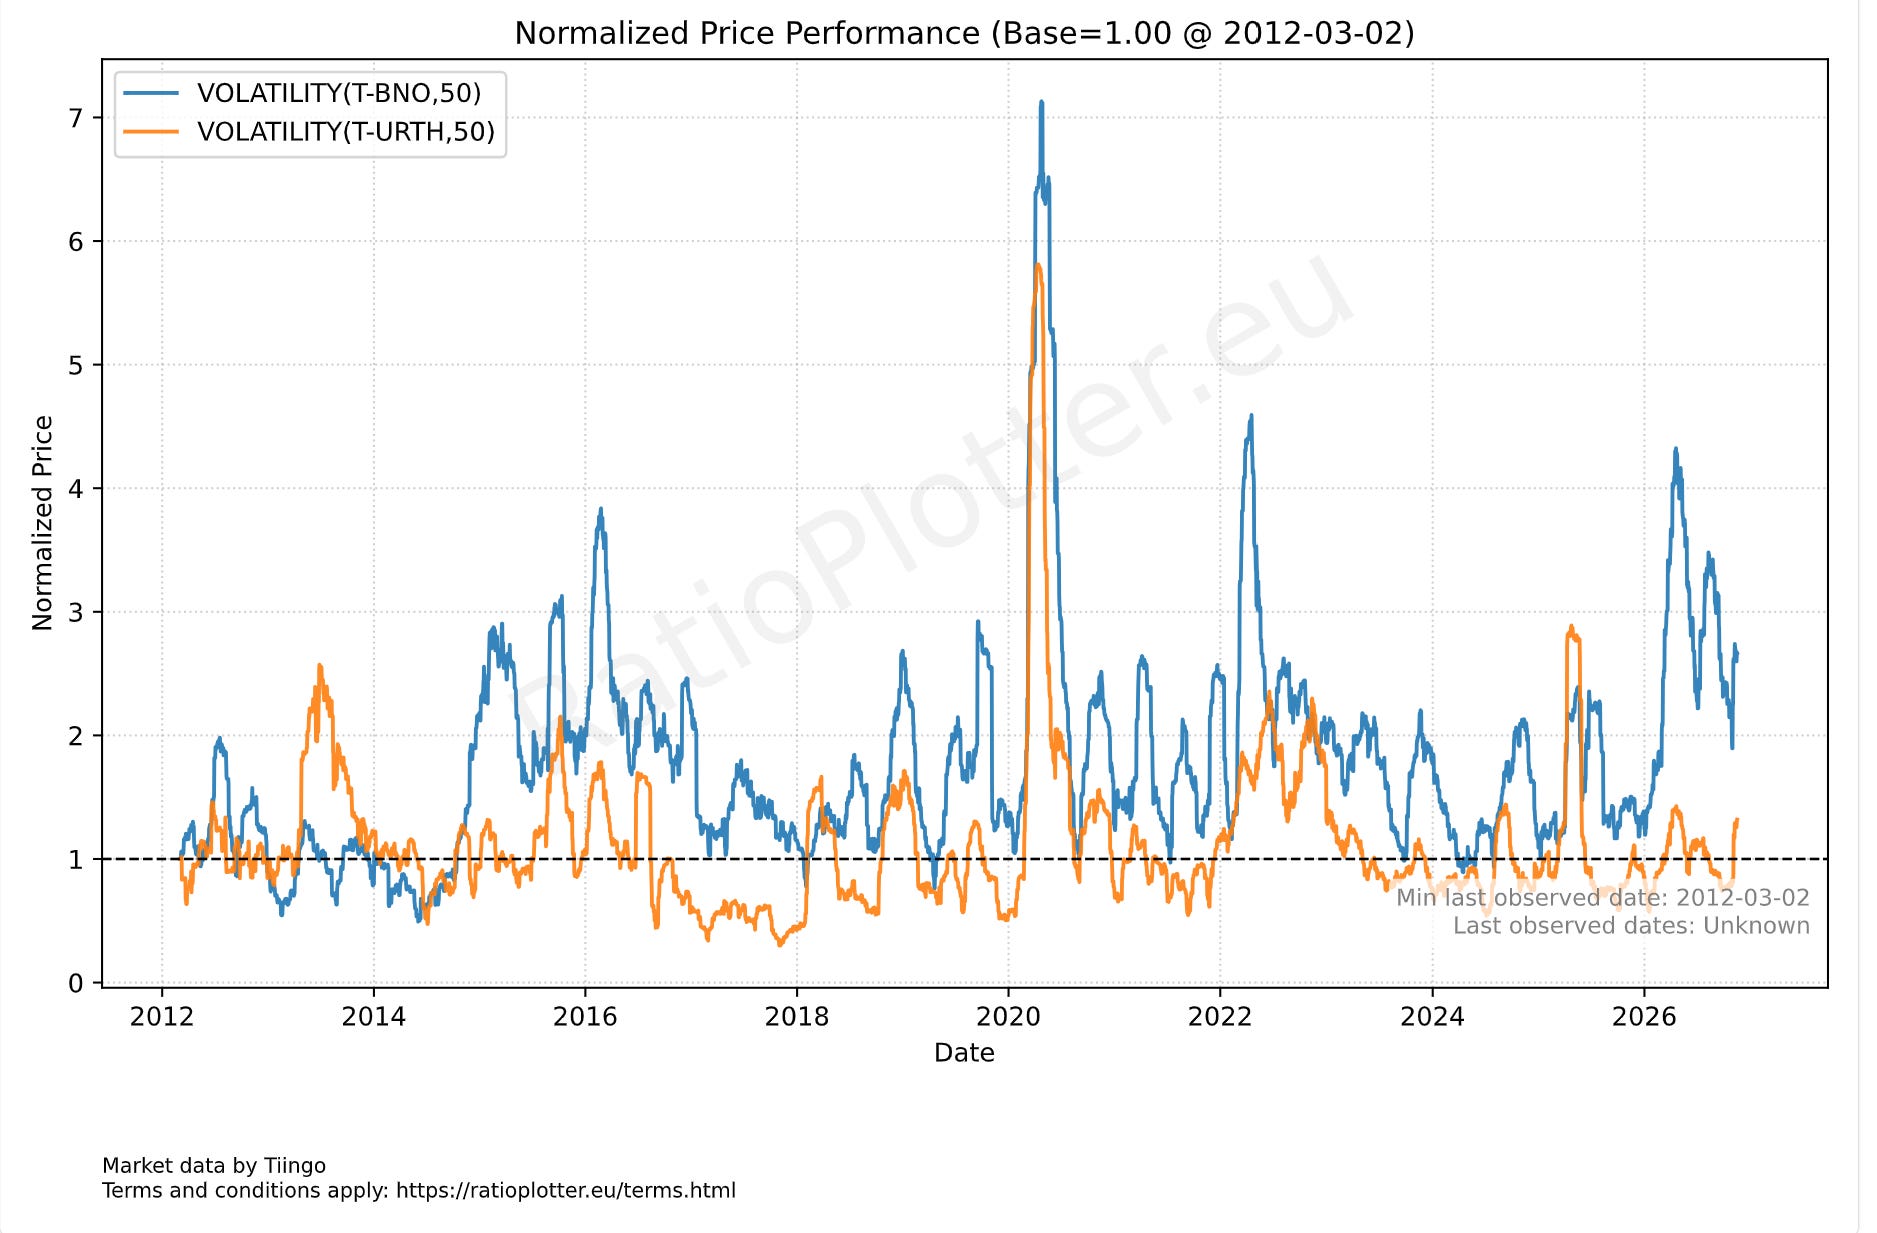
50-day Volatility curves of Brent Oil (T-BNO) and the MSCI World (T-URTH).
Why Brent oil? Because it is more affected than WTI and other benchmarks related to countries which are net oil exporters (U.S.).
Back to the title of the article. Will every trade continue to be an oil trade? Will oil continue to move the markets? And how can we keep an eye on the market and oil volatility?
Well, there is one study predicting that 2027 will have a surplus of oil and that gasoline prices may go up in Europe because refineries are prioritizing diesel production. See: https://www.goldmansachs.com/insights/articles/the-global-economy-is-forecast-to-grow-2-point-8-percent-in-2027-as-oil-prices-decline (The Global Economy Is Forecast to Grow 2.8% in 2027 as Oil Prices Decline). I personally find these predictions difficult to make, as they are largely contingent on Middle East peace, something that really never existed in my generation.
To track how this and other future scenarios develop, I suggest plotting the MSCI World versus Brent oil volatility ratio:
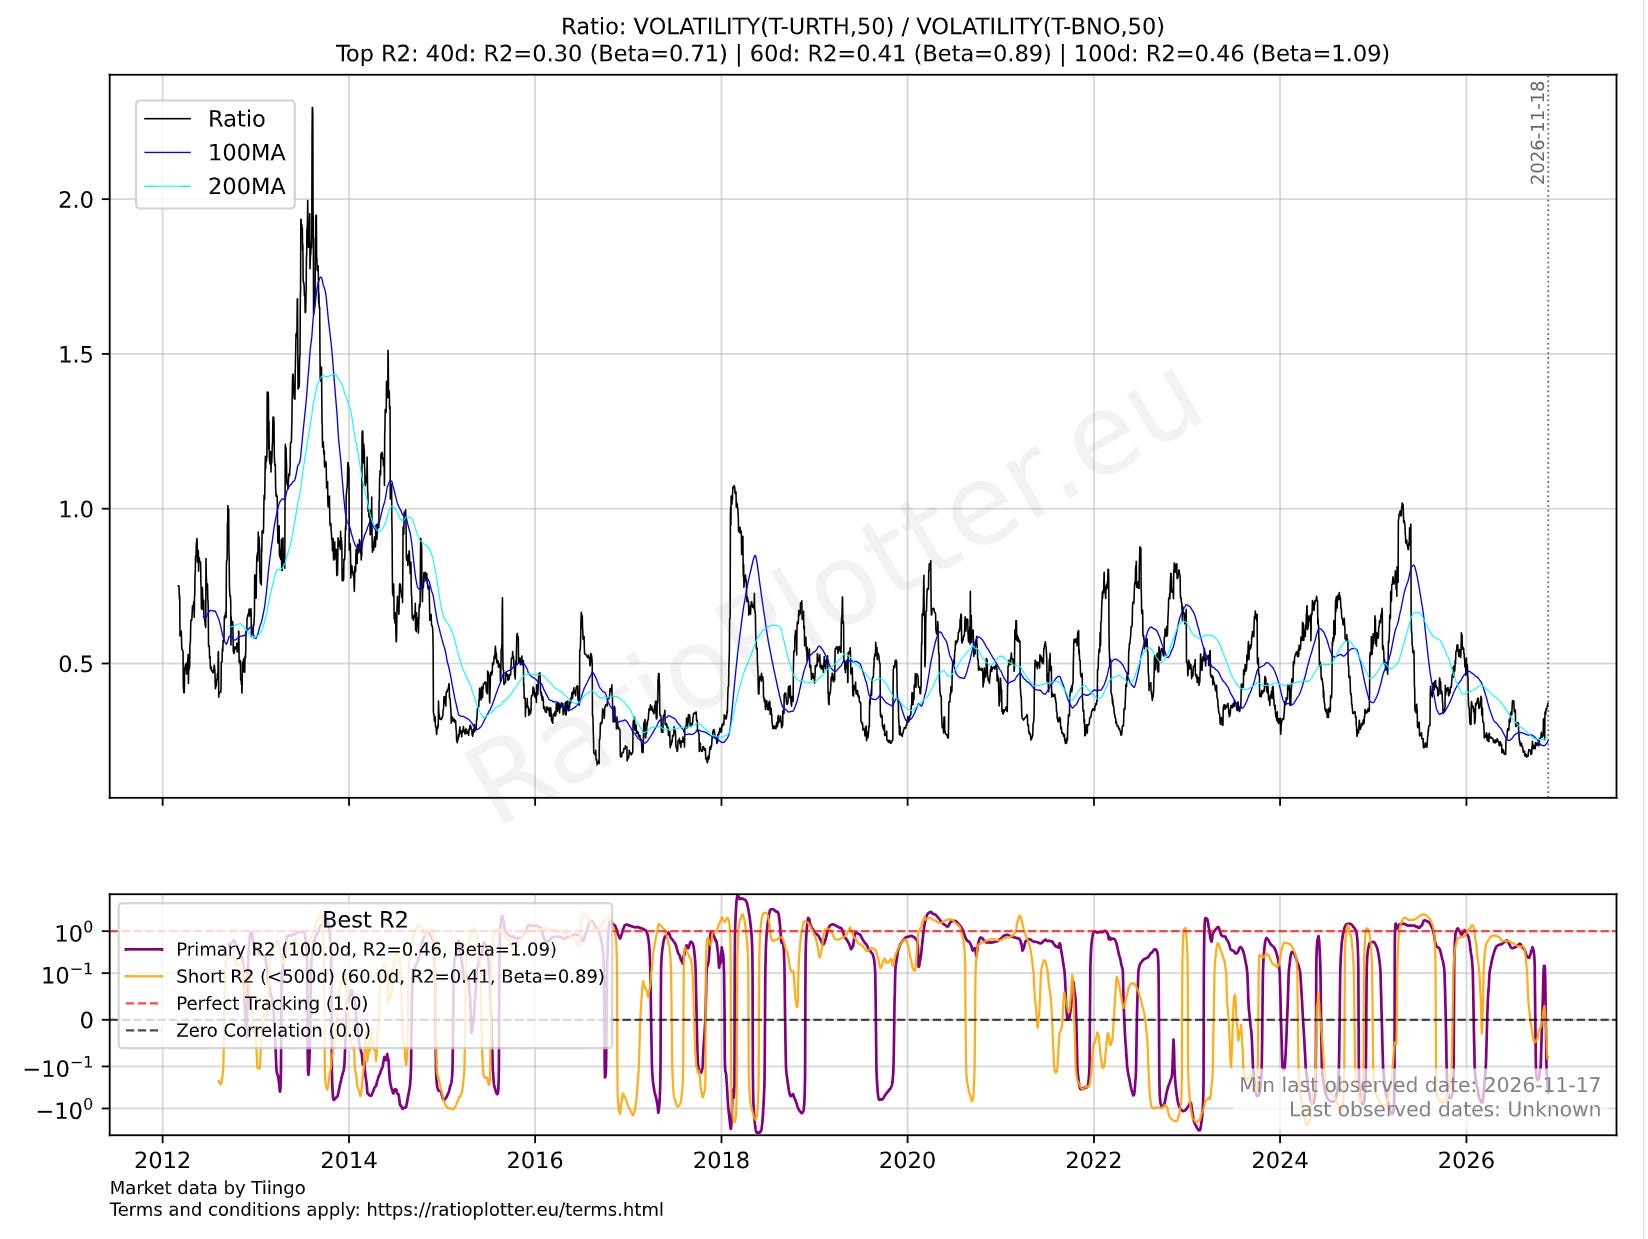
Ratio of MSCI World vs Brent oil volatility. Bottom pane displays the 100-day (red) and 60-day (orange) correlation between the two volatilities.
It seems that the ratio of the market volatility against the Brent oil volatility is trending higher. If we go back to the first chart, both seem to be reaching for a new peak, so why is the market volatility reaching for this new peak more eagerly than the oil volatility? Is the market pricing in some future event? Is it an oil-related event? If we read the news, this week Iran was again launching attacks, so that may explain again the overall volatility uptrend in BNO and URTH. It is also a key week with Trump meeting Putin, Xi, and the North Korean lead all at the same time.
If you look at the bottom pane of the last chart, we have an orange and a red curve. The red curve is the 100 day correlation of the two volatilities and the orange curve is the 60-day correlation. If the two curves are rising, it means oil volatility and market volatility (not prices) are moving together, in correlation. In this regime with the two curves up, the oil market gets shaken up and this shakes up world stock prices as well. If the curves go down, they are losing this positive correlation; it means that oil and stock price volatilities are no longer moving together and are shifting towards a zero or even negative correlation. Steady negative correlation between these two volatilities is nearly nonexistent in this chart as you can see in the bottom pane’s curves where the lines touch the negative correlation side and quickly bounce back up, not staying there for long.
Another chart that can help visualize the trajectory of these two coupled volatilities that are potentially decoupling towards next year is the quadrant plot:
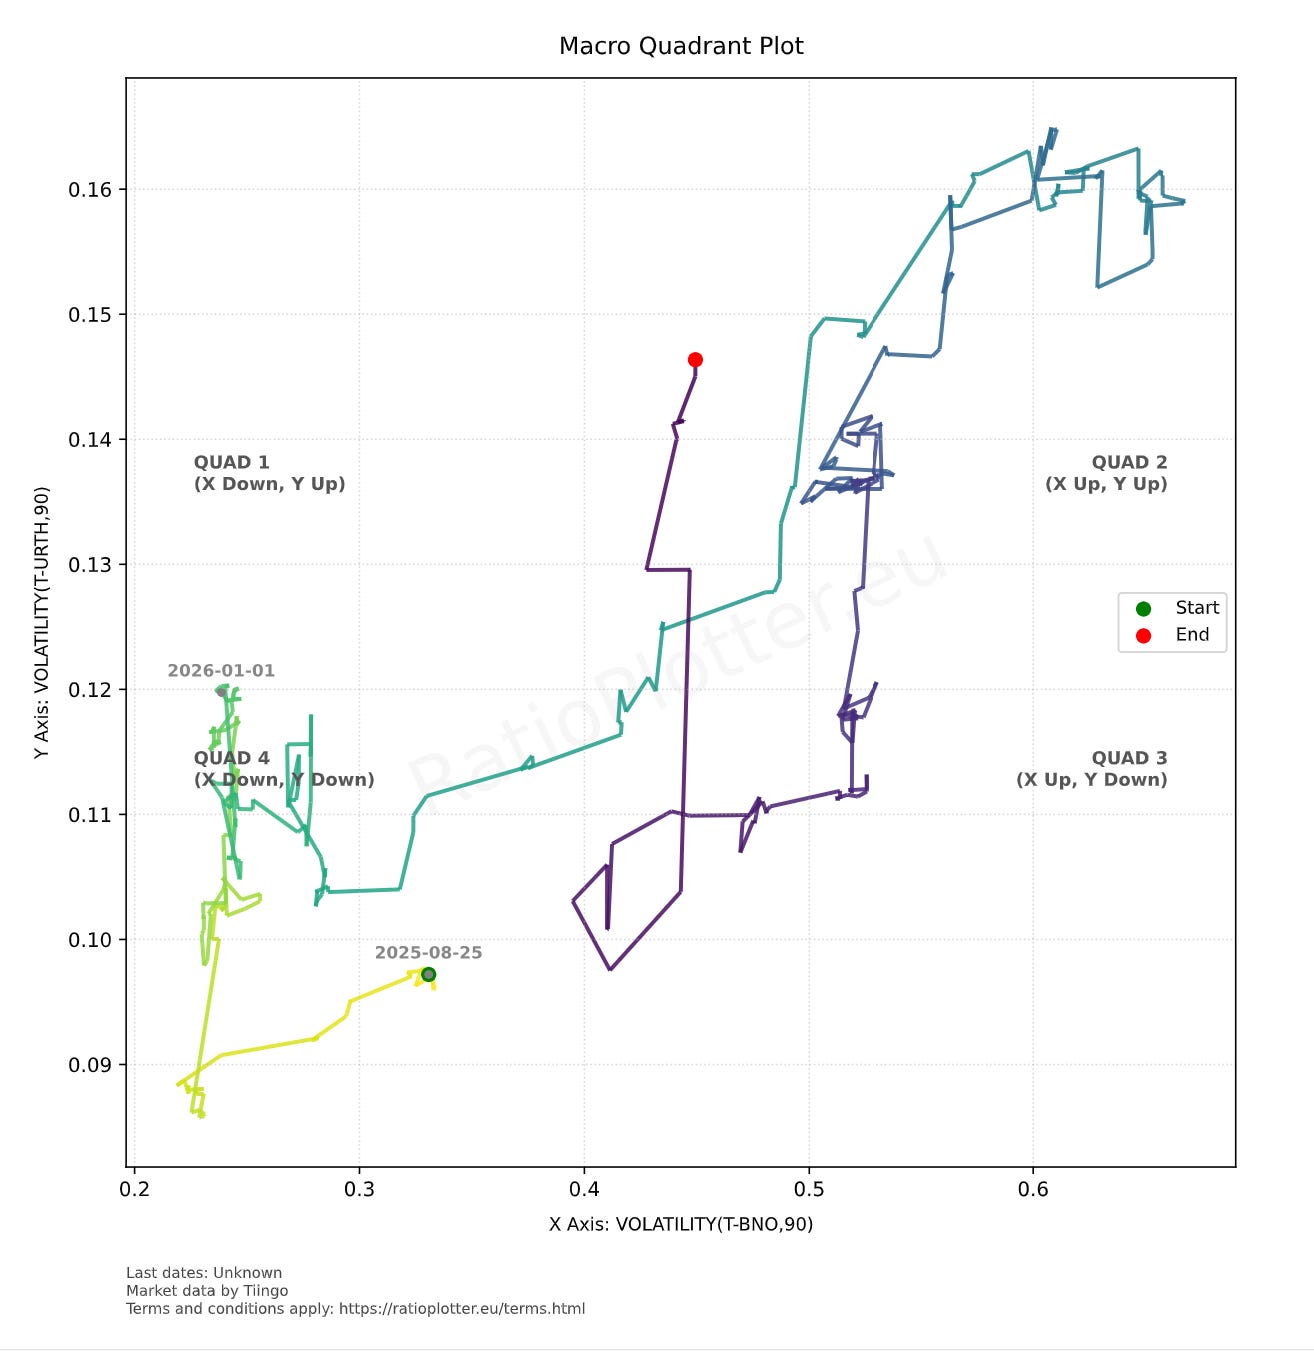
Quadrant plot tracking 90-day world stocks volatility (y-axis) against 90-day Brent oil volatility (x-axis) from 2026-01-01 onwards.
In the quadrant plot, we see that from 2026-01-01 onwards (the yellow to green transition), the world had a trajectory that resembles an upward diagonal towards the top right corner; this means the y-axis (90 day world stocks volatility) is up and also the x-axis (90 days brent oil volatility) is up at a matching rate. We can clearly see the war pausing on the dark blue part of the trajectory, and then as it reaches the purple part it makes a curve and reaches vertically up, with the world volatility (y-axis) spiking up while oil volatility remains still. One hypothesis for this spike in world volatility is the lagged effect that high oil and diesel prices have on consumer goods prices (I have written numerous articles and notes about this).
Ultimately, I find that predictions hinging on Middle East peace historically have been hard to rely upon. While I hope for peace and cheaper oil in 2027, I would keep an eye on these charts to follow exactly where we are and what the market and the people with knowledge or control of the next world events are already pricing in.