Which Ordered Price Pair Can Be Used to Build the Best Model?
Currently, there is a substantial amount of volatility in nitrogen fertilizer prices due to the Iran conflict. This volatility is clearly evident in the two recent major spikes in the Producer Price Index for nitrogenous fertilizers, visualized as the blue line in the "Normalized Price Performance" chart below.
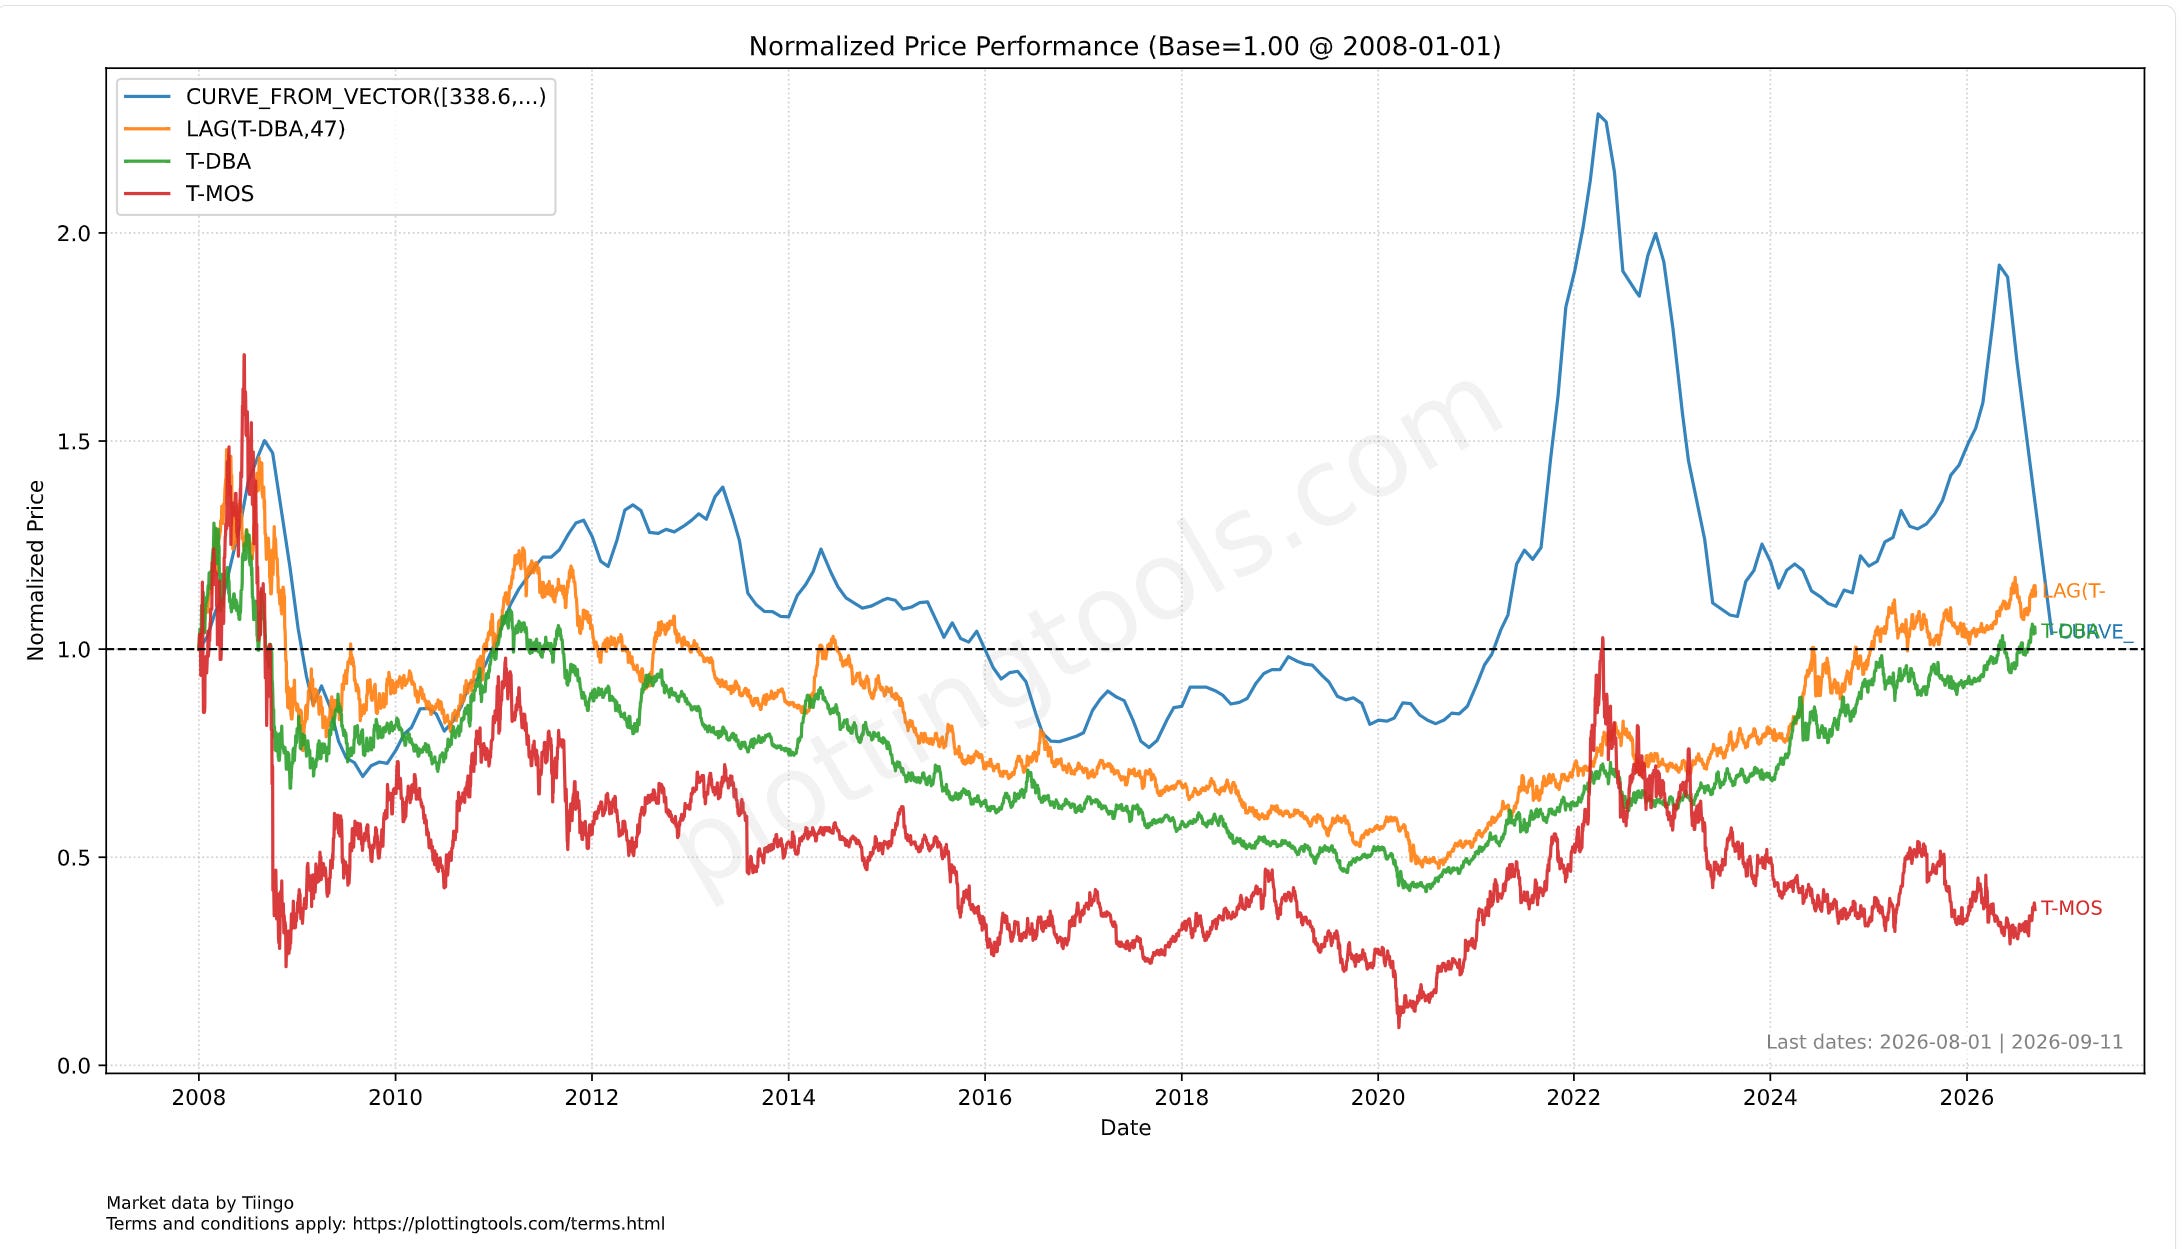
Because volatility can present unique analytical opportunities, I decided to gather a dataset for (1) Nitrogen Fertilizer Prices, (2) Agri-Commodity Prices, and (3) Fertilizer Company Stock Prices to model all pairwise combinations. I tested both directions, with and without introducing a data lag. It turned out that the best model was achieved using a specific proxy for agri-commodity prices to explain a particular fertilizer company’s stock price.
Let's review the specific data series selected to narrow down the noise:
- Nitrogen Fertilizer Prices: I utilized the Federal Reserve Bank of St. Louis (FRED) data for the Producer Price Index by Industry: Nitrogenous Fertilizer Manufacturing: Synthetic Ammonia, Nitric Acid, Ammonium Compounds, and Urea (PCU325311325311A). Note that this tracks the manufacturing cost price rather than the end-sales price, though they correlate closely around the same period.
- Agri-Commodity Prices: I opted for the Invesco DB Agriculture Fund (ticker: DBA, tracked as T-DBA in our system). I chose it primarily for its extensive historical data. It acts as an investment strategy overlaying variable positions on various agricultural commodities rather than a static index.
- Fertilizer Company Stock Prices: To isolate the data from the direct shocks of the Iran war, I selected The Mosaic Company (ticker: MOS, tracked as T-MOS). Mosaic does not manufacture traditional synthetic nitrogen fertilizers like ammonia or urea; instead, they are a massive purchaser of ammonia to create their phosphate products.
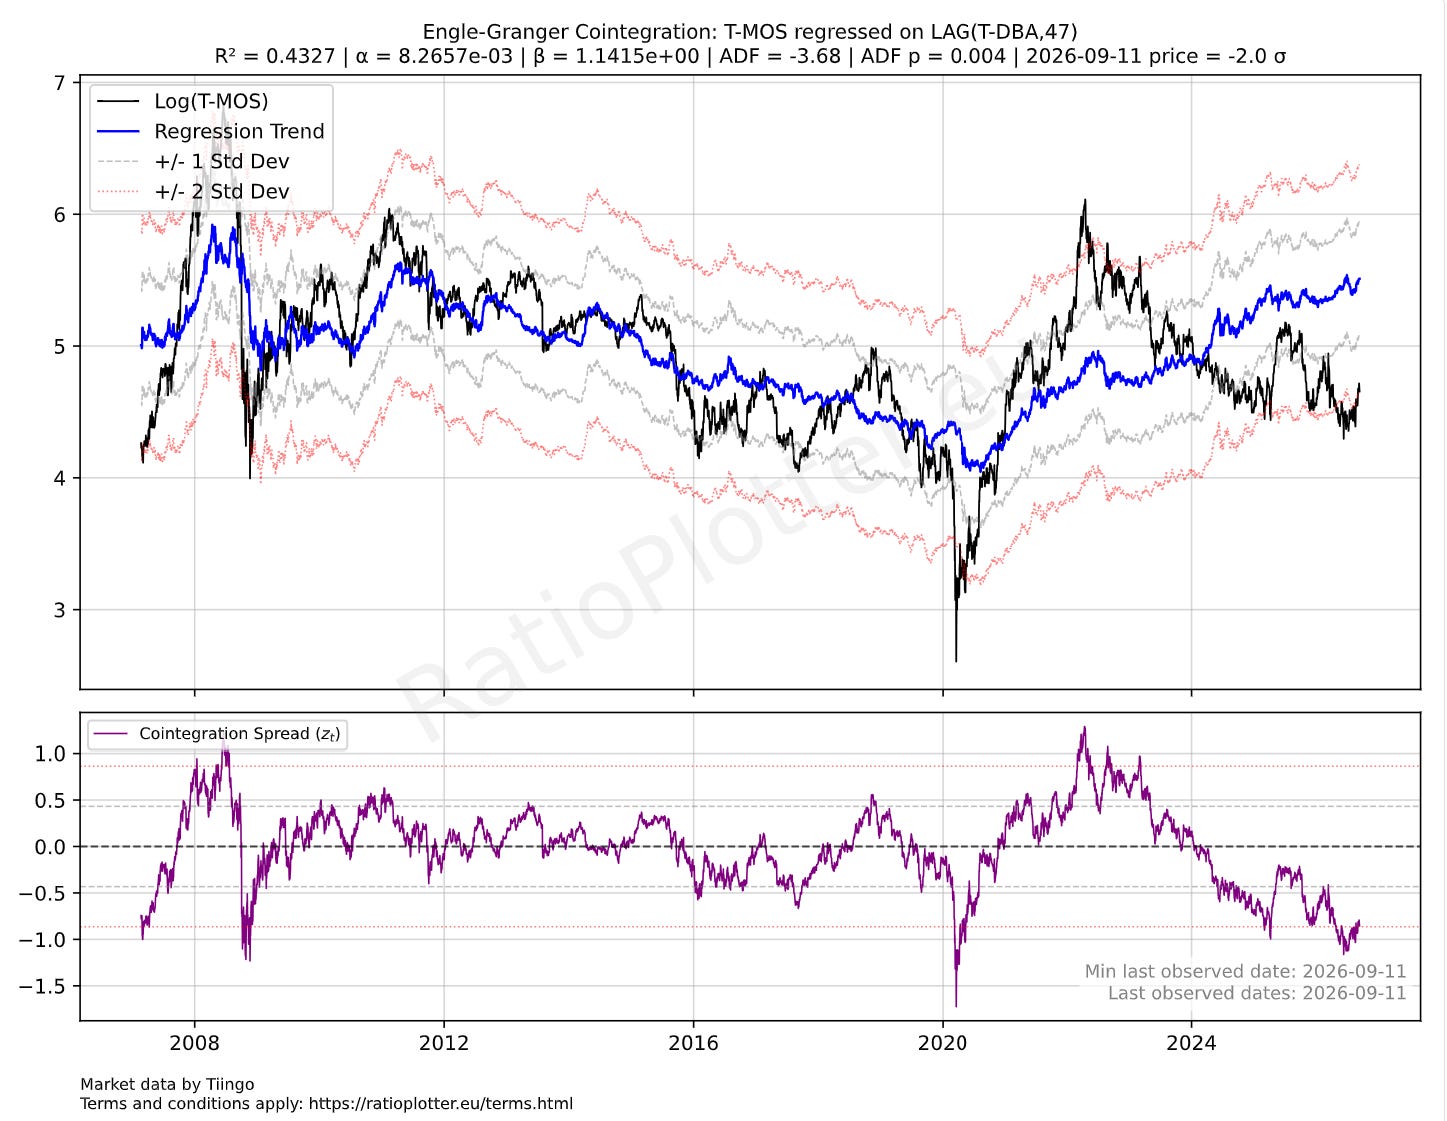
While space prevents showing all 30+ iterative models (which included various pairs, directions, and time lags simulating delayed causality), the best-performing model emerged as an Engle-Granger Cointegration: T-MOS regressed on LAG(T-DBA, 47). Interestingly, the lag length did not heavily dictate performance; variants between 0 and 47 days lag all yielded very low ADF p-values and highly negative absolute ADF statistics.
The resulting model is displayed below. Observe the dark blue trend line representing the model against the actual price spread (black line) between Mosaic (MOS) and the DB Agriculture Fund (DBA). The recent descent of the black line indicates a necessary mean-reversion dynamic: either agri-commodities must decrease in price, or Mosaic’s stock price must rise to realign with the blue mean trend line. Given that Mosaic's Price-to-Sales valuation is historically low, this poses an interesting divergence.
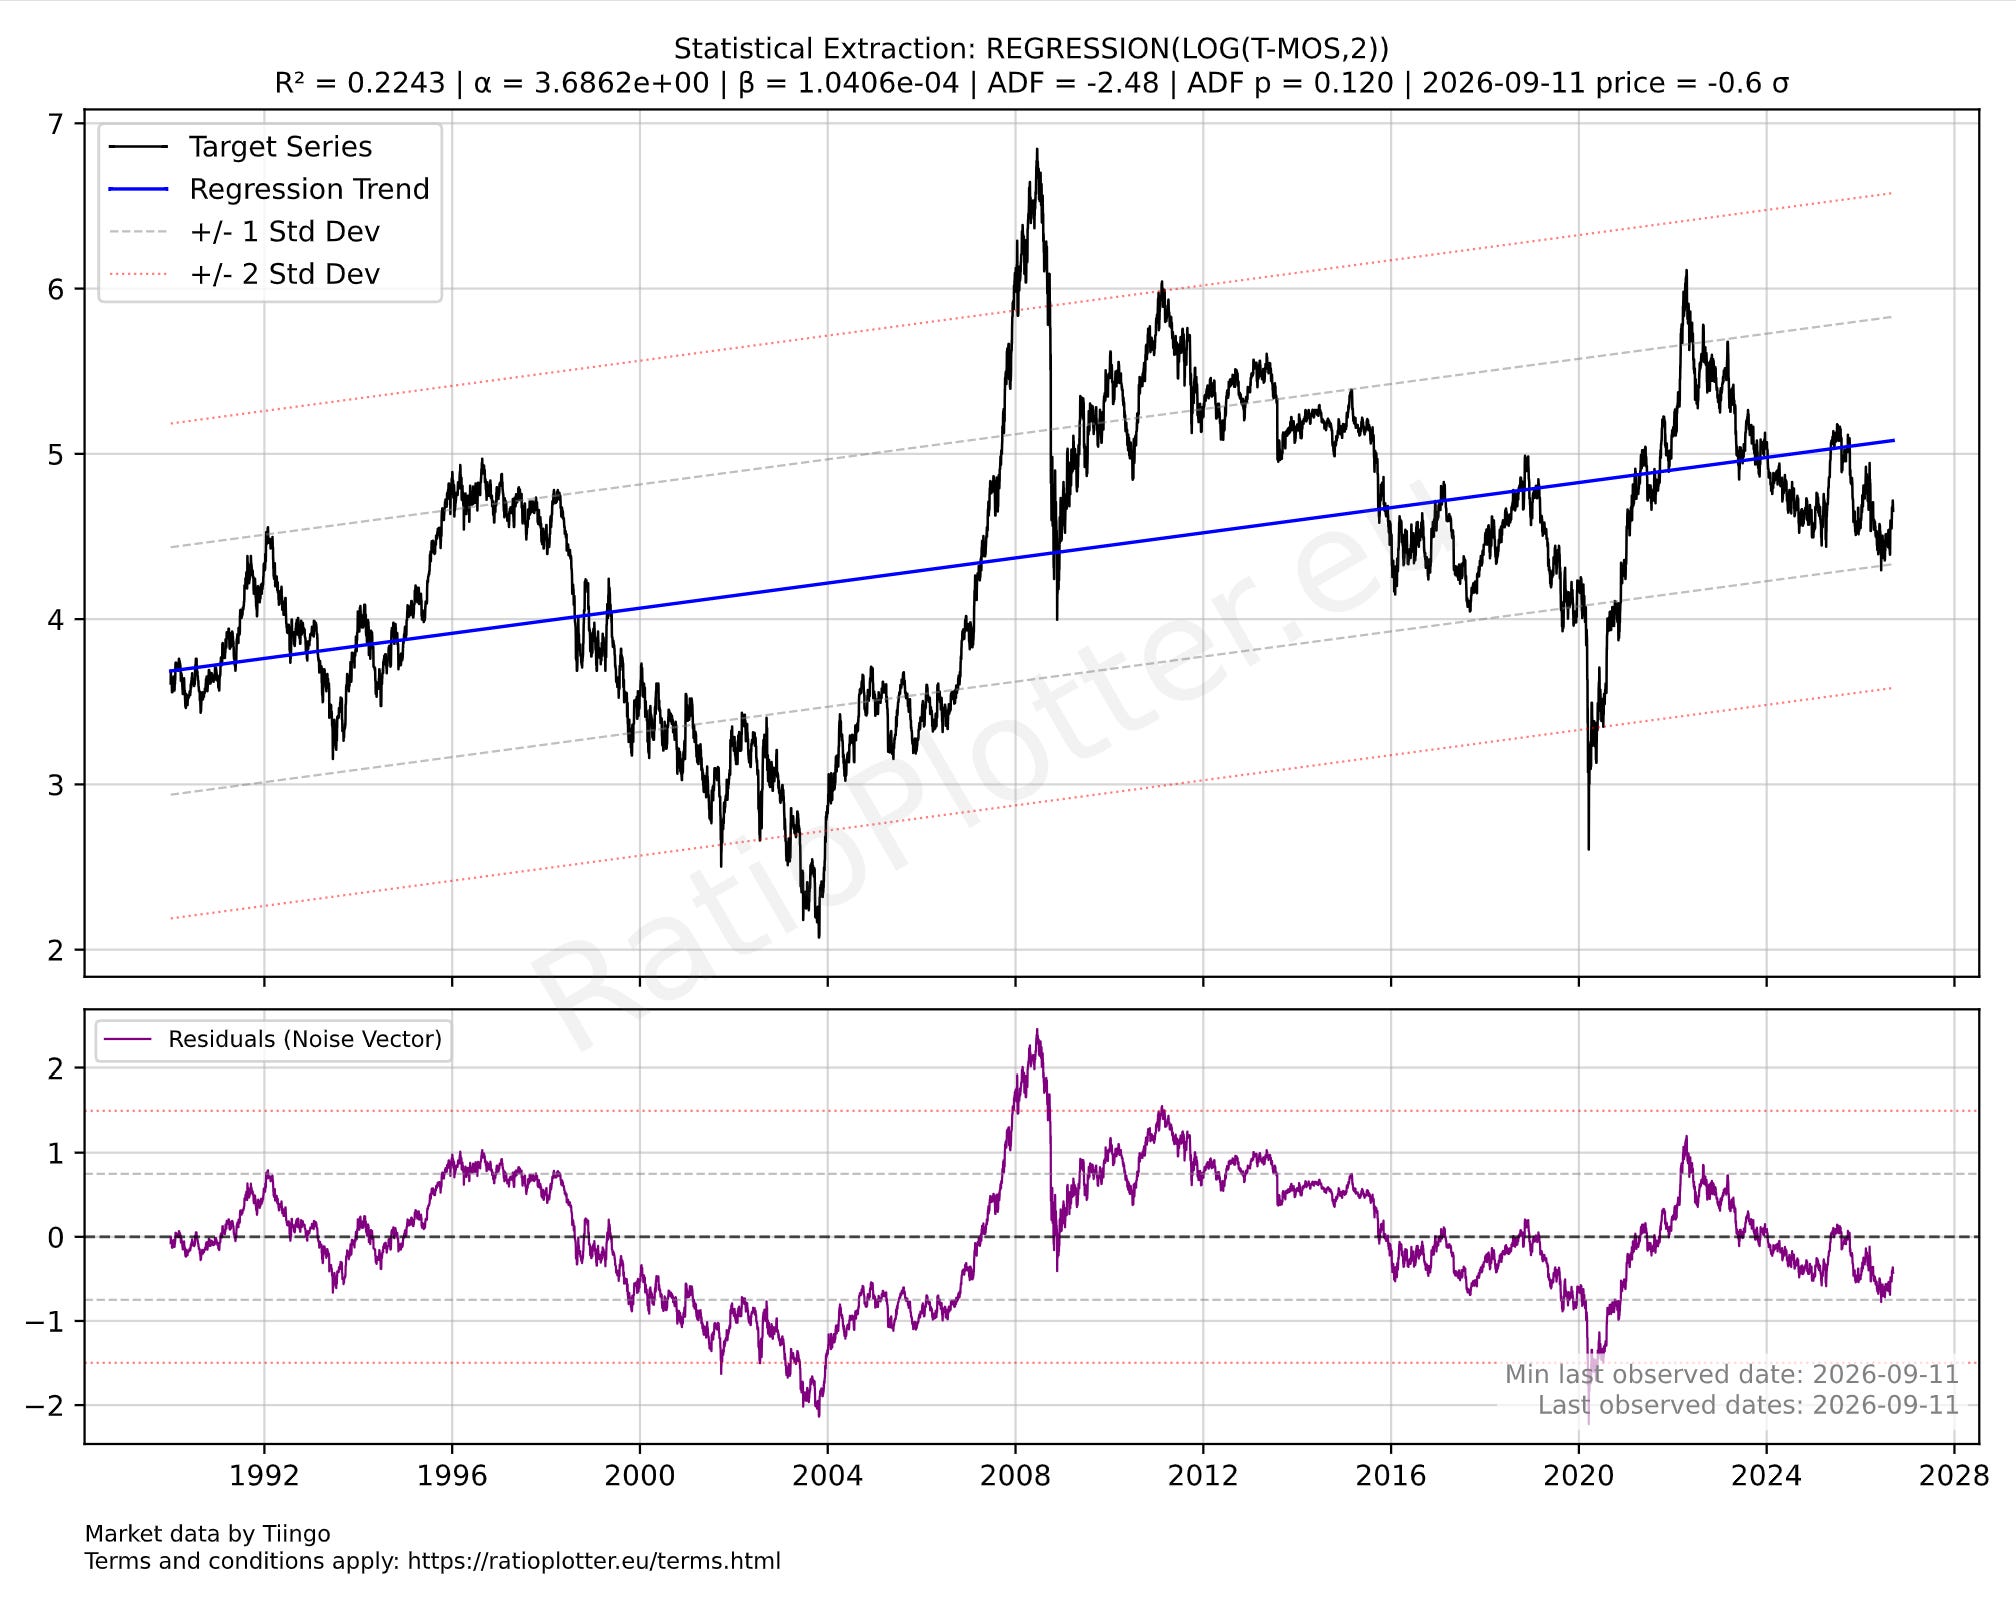
Complementing this analysis, the following chart illustrates a statistical extraction of the exponential price trend for The Mosaic Company over the years (Model: REGRESSION(LOG(T-MOS, 2))). This model confirms an upward structural expectation for Mosaic, though it carries a slightly higher ADF p-value.
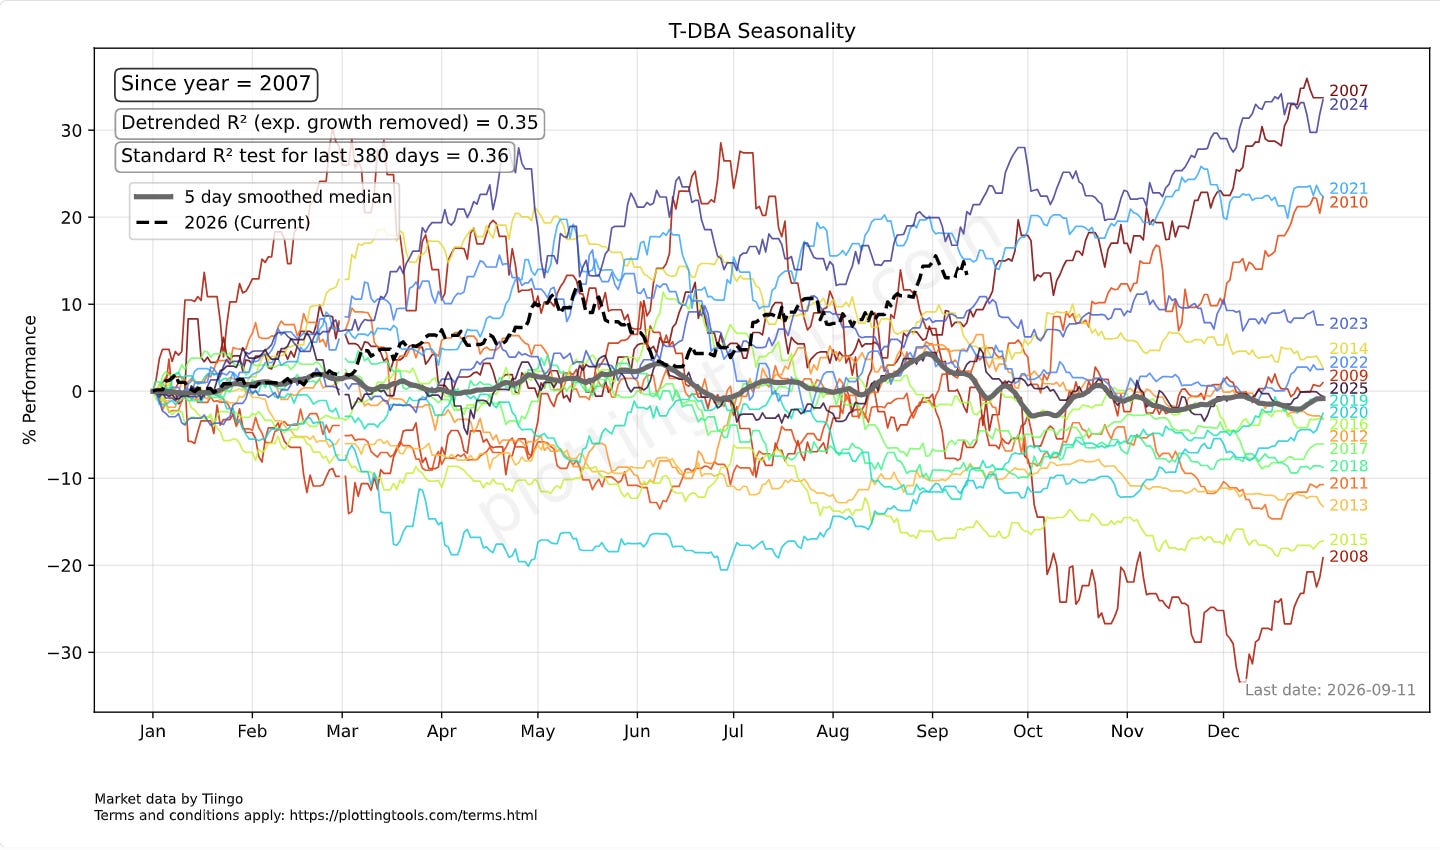
Regarding T-DBA itself, a logical starting point for investigating current commodity price positioning is the DBA seasonality chart provided below. Note the typical yearly seasonal downtrend extending from September through October (the Northern Hemisphere harvest). While seasonality dictates one pattern, macroeconomic anomalies like El Niño or geopolitical conflicts can easily override it. Observe that while 2025 was relatively flat, the sequence of 2021 through 2024, and now 2026, have been distinct uptrend years.
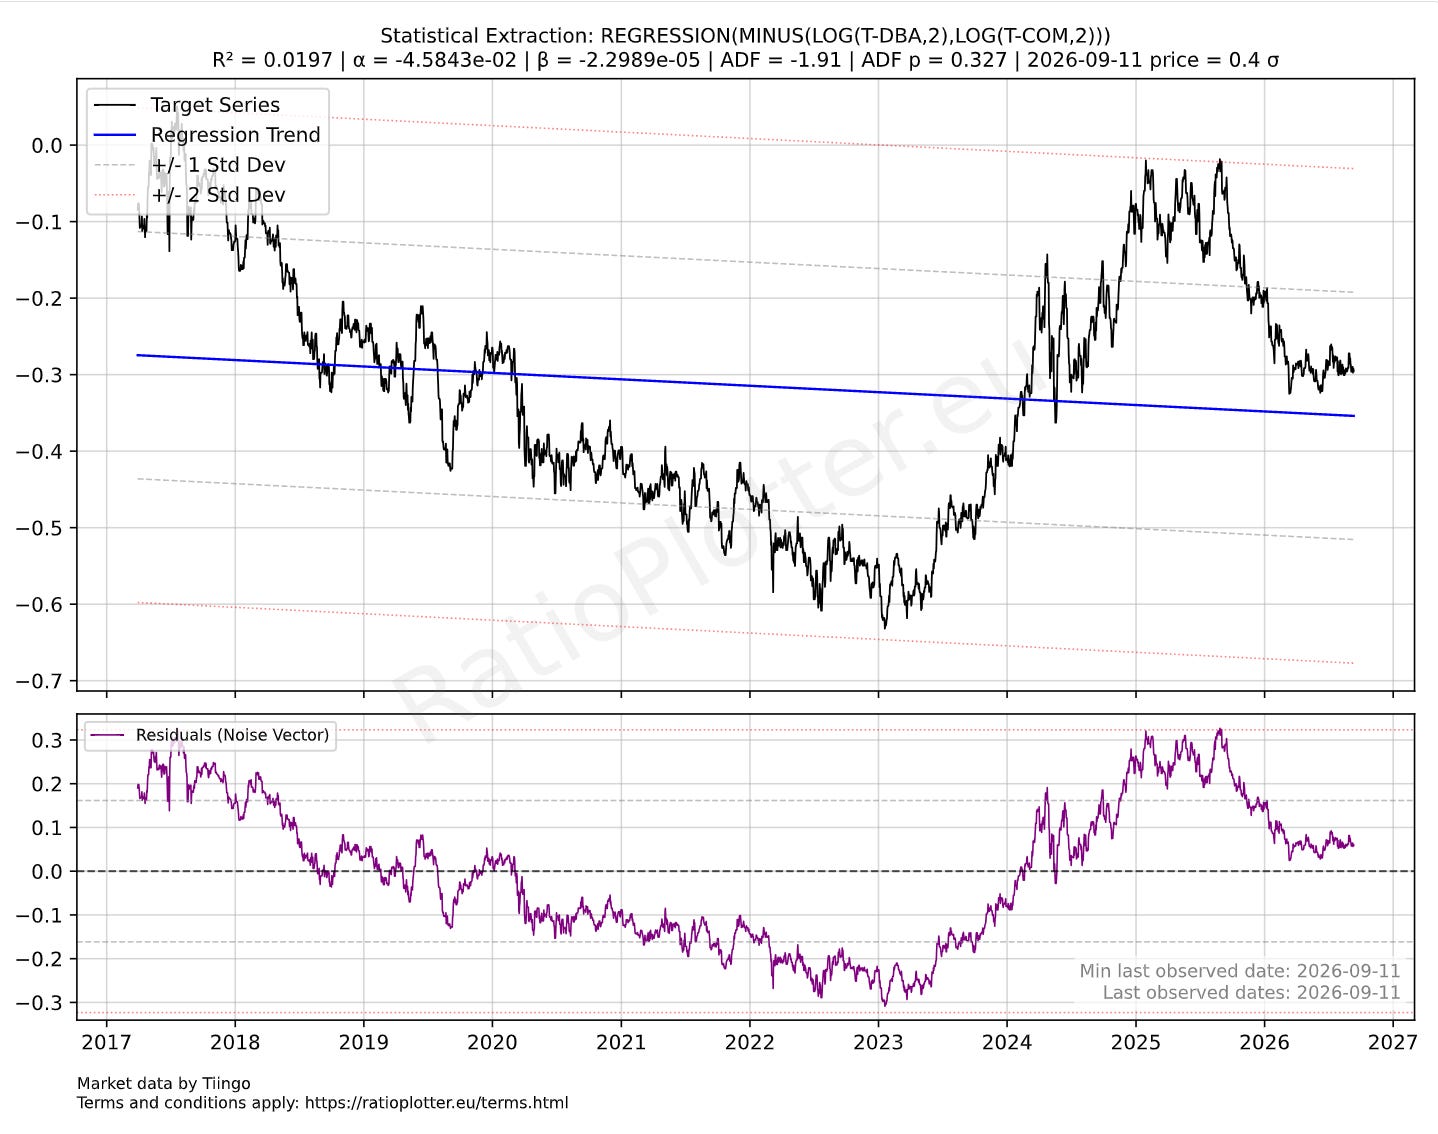
I also tested a standalone model on T-DBA prices (REGRESSION(LOG(T-DBA,2))), but the resulting ADF-p was too high to indicate reliable mean reversion. This likely stems from currency debasement interference or the fact that commodity super-cycles require longer historical data than the 2008 inception of DBA allows. To address this, I attempted a currency-neutral approach, modeling the ratio of DBA against a broader commodity basket (COM), as seen in the chart below. Unfortunately, it still lacked a strong mathematical probability of mean reversion.
Addressing Causality and Market Mechanisms
For those arguing that correlation does not equal causation, it's worth exploring the hypothesis linking high agri-commodity prices in our model to almost immediately elevated fertilizer stock prices. The near-zero optimal lag between agricultural commodity prices (DBA) and Mosaic’s stock price (MOS) likely occurs because equity markets operate as forward-looking discounting mechanisms, instantly pricing in expected behavioral shifts.
While one can accurately tie high crop prices to current low supply (e.g., failed harvests due to El Niño weather shocks), stock prices are not reflecting the physical fertilizer consumed during that failed harvest. Instead, they are pricing in the anticipated fertilizer demand for the *next* planting season.
Furthermore, farmers may have recently postponed fertilizer applications due to elevated input costs stemming from the Iran war, or a temporary inability to fetch crop prices high enough to justify the expense. However, postponement is not elimination. Now that agri-commodities are spiking upward, farmers have the financial justification (via cash flow or loans) to apply fertilizer heavily and maximize future crop yields. This mirrors the classic commodity lemma: high prices beget low prices, and low prices beget high prices.
So why is Mosaic currently deviating below what the model suggests it should be worth relative to rising agri-commodities? It could be fear of the Iran war, or systemic short-termism focusing on immediate earnings rather than the overarching price-to-sales trend. Mosaic did suffer an earnings squeeze over the last two years despite slowly increasing total revenues, which might explain the relative price drop against agri-commodities.
Investigating the precise weight of each of these fundamental drivers is beyond the scope of this post, which focuses on econometrics and modeling frameworks. I welcome your thoughts and technical critiques in the comments.
Subscribers can access the live models: Engle Granger Cointegration Model on MOS and DBA.