How to Simulate Reinvesting Dividends at your Return Rate, a Case Comparing Alphabet and Microsoft
Suppose your portfolio CAGR or compound annual growth rate is 30% which is a bit higher than the rate Alphabet or Microsoft manage to grow their revenue. This means that if you have 100000 in your portfolio this year, next year you will likely have something close to 130000, about 30% more. Of course this growth will take place more or less on a daily basis and be subject to volatility.
When you plot T-GOOGL with our system, you are not simulating reinvesting the dividends from Google (Alphabet) into your portfolio and subjecting it to investment in whatever stocks you are currently busy acquiring. Instead, when you plot T-GOOGL it simulates you reinvest the dividends from Google (Alphabet) into Google stock as soon as the dividends are paid. This is the standard in the industry. Our data provider Tiingo provides this data in the column T-GOOGL-AdjClose. Since this is what most users want when plotting Google we make T-GOOGL default to T-GOOGL-AdjClose. There are more projection columns such as: T-GOOGL-SplitAdjClose and T-GOOGL-Close which you can read about at the bottom of every plotter page.
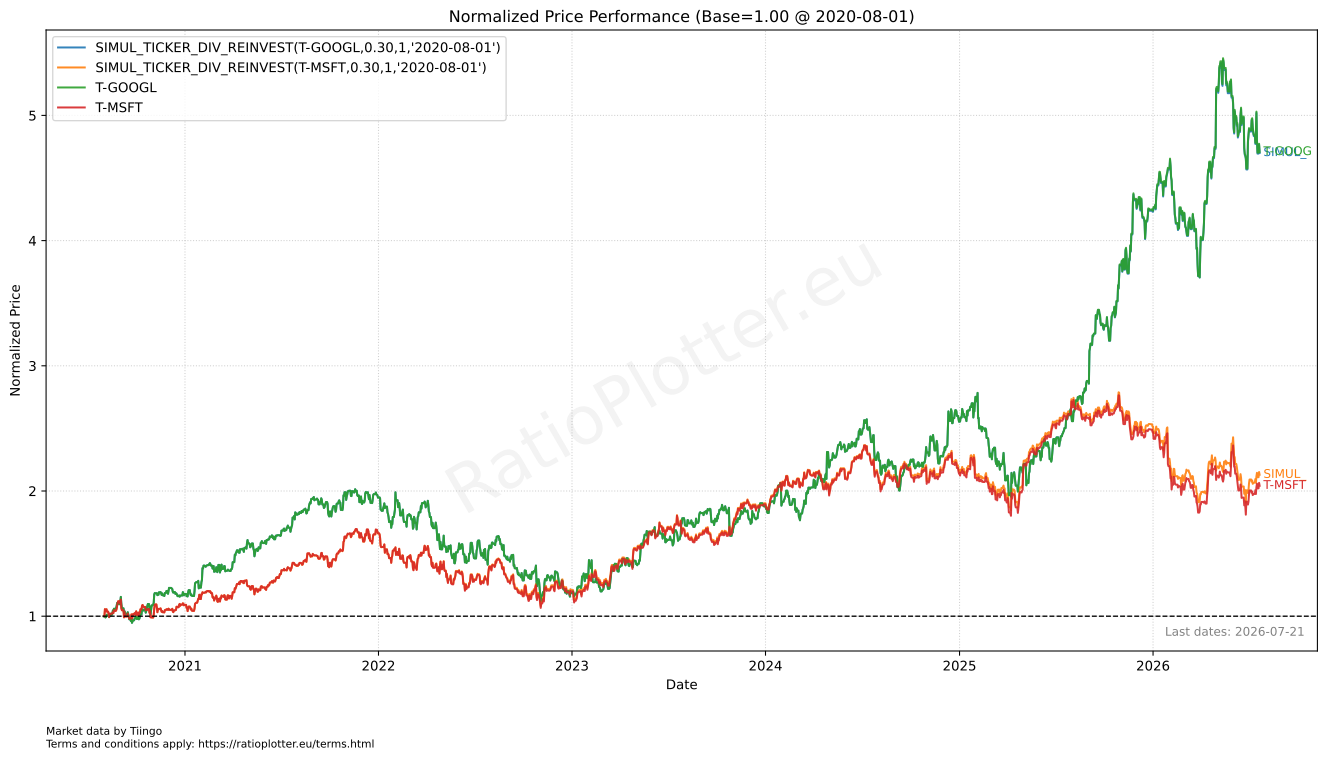
If you want to simulate reinvesting the dividends at a return rate of say 30%, then you have to use one of our functions called: SIMUL_TICKER_DIV_REINVEST(T-GOOGL,0.3,1,'2020-08-01'). This is a function only available to advanced subscriptions. The first argument of the function is the ticker you are simulating. It would only make sense with tickers that pay a dividend. The second argument (0.3) is your portfolio CAGR (i.e. 30%), this is the return you will get compounding over your dividends bucket for this stock. This function displays for every day both the dividend bucket and the stock price added (it does take splits into account automatically). The 1, which is the 3rd argument is the initial investment in the same currency as the stock price, this is one dollar, not one share. You can put two dollars or the price of one share at that date. The last argument, the date, is when you started this investment. This function can be combined in all our plots next to various functions. We demonstrate it below in the overlay plot.
Our tool allows you to plot a simulation curve that gives your total return of investing in say T-GOOGL while
using their dividends (Google's dividends) to boost your own portfolio gains. Here is the result of one such
simulations:
 For the up to date chart click here
Notice how the blue and the green curves for Google overlap.
This happens when the company rate of return approaches that 0.3 parameter of our portfolio rate of return,
and it also happens when the company has just started paying dividends and we did not have timie for the curve
with dividends reinvested at our portfolio return rate (blue) to diverge from the curve with dividends reinvested
in Google/Alphabet itself (green curve).
In order to use this simulation function you will have to copy and paste it and adapt it on other plotting screens.
I hope you have enjoyed this article. This article helps plotting returns in retrospect, for known past dividends.
If you want to do forward looking simulations of dividend reinvestment I suggest you look at our: financial calculators