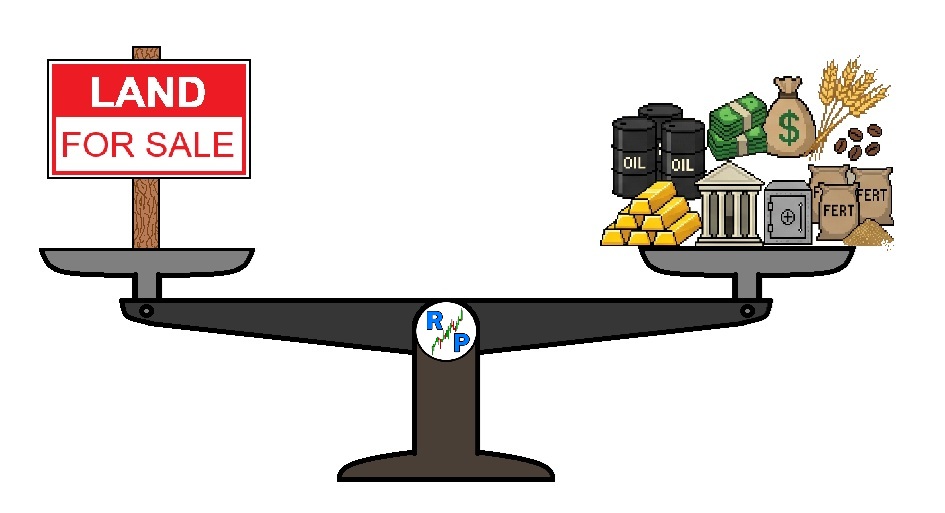
Can the Laggard Be the Safest Bet? Comparing Land And Market Growth Against GDP.
Land assets traditionally appreciate at a slower pace than high-growth technology equities. However, when tech and broader markets become stretched, suppressed land valuations offer a compelling defensive profile: a high probability of upward mean-reversion or capital preservation while inflated assets undergo a drawdown. Once that relative rebalancing occurs, rotating capital back into growth assets becomes the natural next move.
Also, comparing Land stocks with tech stocks purely on a price basis is unfair, as land stocks typically pay juicy dividends, while tech stocks tipically pay little or no dividend at all.
We therefore compare the price of land stocks to the world GDP growth first.
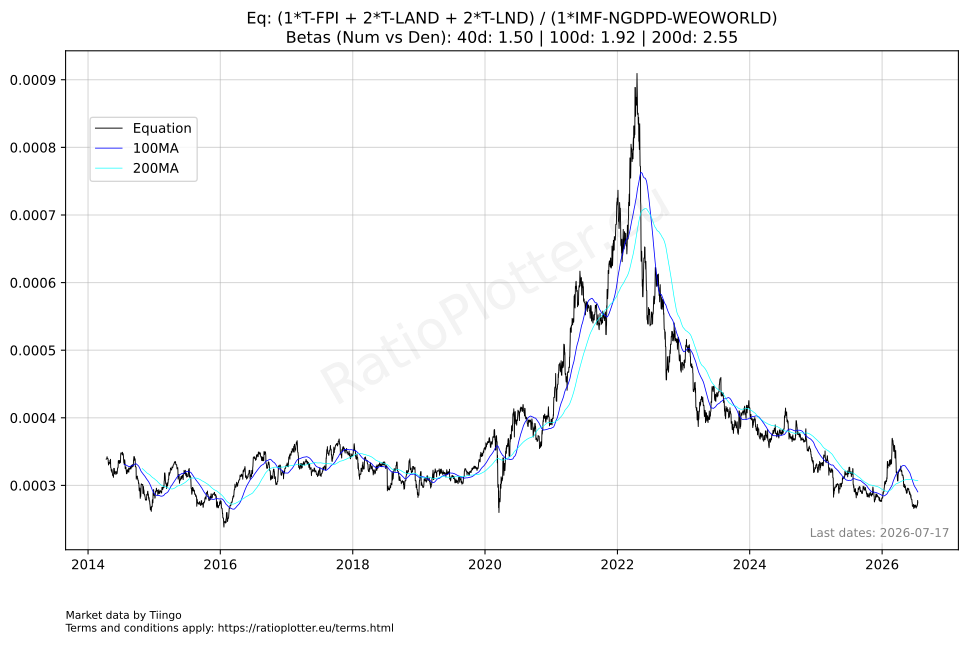
The ratio of a basket of land stock prices to the world GDP:
Open up to date chart (opens in a new tab)
While it may seem that land stocks do not increase in value against GDP, they do correct from time to time. And more important, all our land stocks pay juicy dividends which the world GDP does not (dividends not shown in the chart). So the trick can be to lock a 10% dividend on the land stocks which then can be used in many ways such as: (1) As a lombard loan collateral on DeGiro or SwissQuote; (2) As a dividend yield to invest in tech stocks; (3) As a hedge to swing back into tech stocks after a correction; (4) All of these depending on the situation.
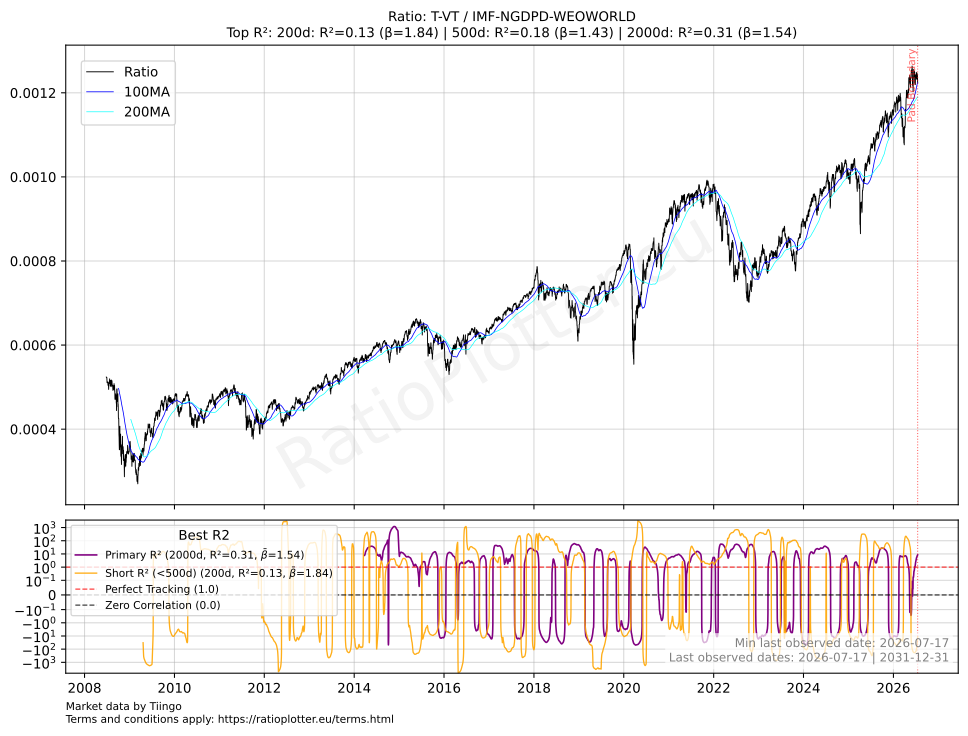
The ratio of a world stock market index to the world GDP (Buffett Indicator proxy):
Open up to date chart
(opens in a new tab)
Do you know what the Buffett indicator (stock market to GDP) means? At the moment pictured above, the market would be considered expensive.
Technology assets have dominated the above market returns for decades. But while AI can optimize supply chains, automate labor, and squeeze unprecedented efficiency out of existing resources, it cannot manufacture physical land.
In fact, should rapid automation drive widespread job displacement and curb consumer spending on discretionary goods, capital may naturally retreat toward the indisputable tangible value of basic necessities—food, water rights, shelter, and energy—all anchored in land. Ultimately, AI runs on watts and raw materials, both extracted directly from the planet's surface. (Exploring how this dynamics extends to mining equities and physical real estate is a topic for a future article.)
Explaining the GDP Comparison Charts Above
Both charts above are made with tools from ratioplotter.eu. The first chart plots (T-FPI + 2*T-LAND + 2*T-LND) / (IMF-NGDPD-WEOWORLD). Thus it plots an equation of tickers from our ticker space. The equation has on the numerator a basket, or if you wish a portfolio, of land related stocks. T-FPI is the Tiingo ticker prefixed Farmland Partners Inc (the Tiingo prefix T- is behind every stock ticker we use). T-LAND is the Gladstone Land Corp ticker in our ticker space, it is also a company who owns considerable land. As of 2026, Gladstone Land Corp is doing buybacks so it considers its stock cheap in relation to its land assets. Finally T-LND is BrasilAgro (Companhia Brasileira de Propriedades Agrícolas) a company that buys, develops and sells land in South America. The coefficients adjust their stock prices as of today to be of the same magnitude. Finally the denominator is one of our daily price series from the International Monetary Fund (IMF-) ticker space, in this case the series for the world Gross Domestic Product in dollars. The second chart above plots T-VT by the world GDP. T-VT is The Vanguard Total World Stock Index Fund ETF.
How About the Ratio of Land Price to Gold or Gold Miners?
Gold is said to be a good store of value. It is said that if you could buy a house with gold a few centuries ago, then today you most likely can buy a similar house with the same amount of gold.
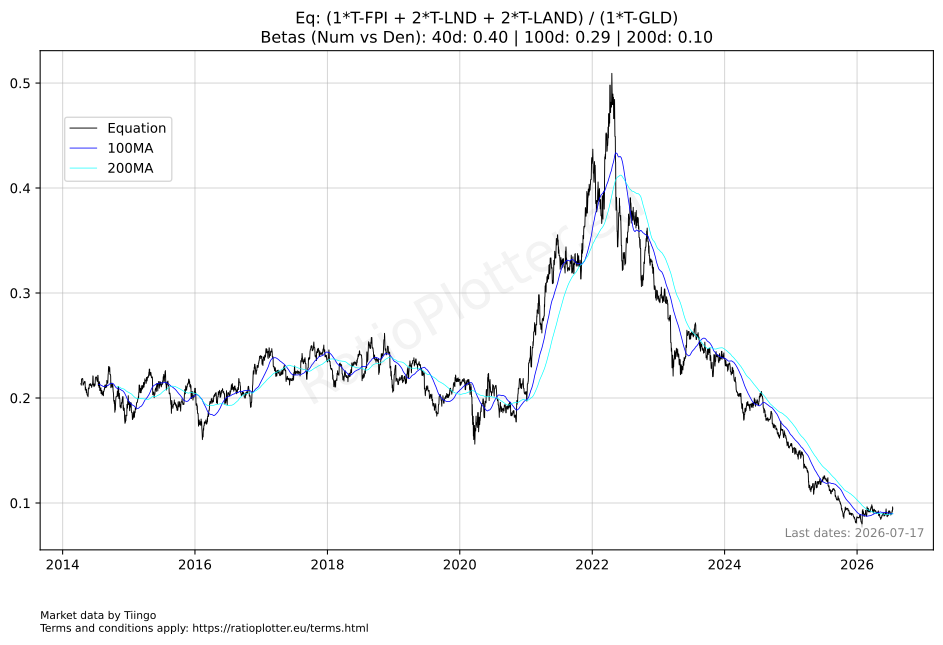
First the ratio of the same basket of land stocks to gold commodity prices.
Open up to date chart in another window.
(opens in a new tab)
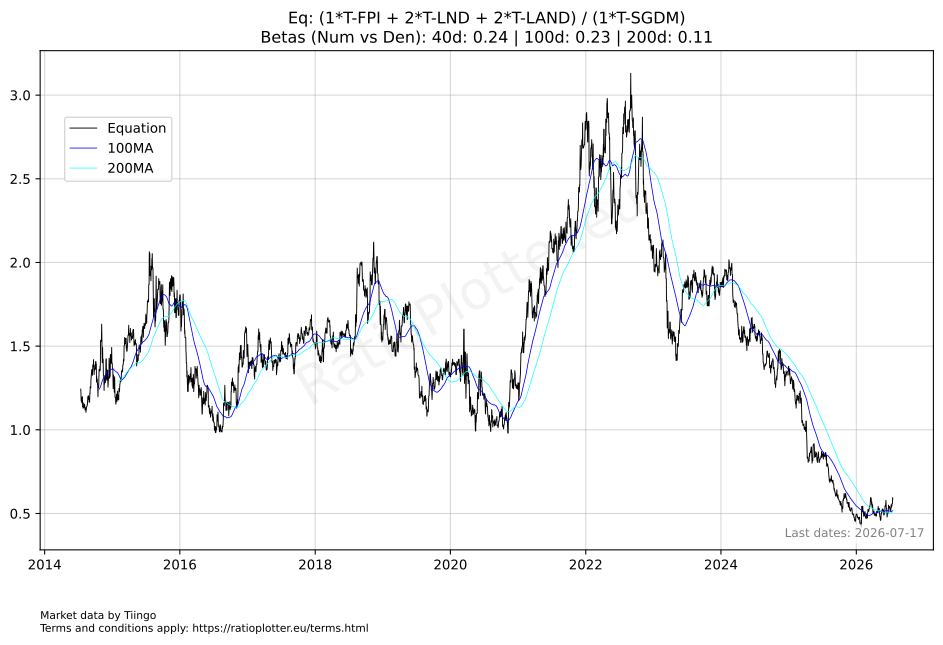
Notice that all our land stocks above pay strong dividends, most of them are REITs. Therefore it is more accurate to plot them against gold miners who also pay a dividend.
We choose to plot them below against T-sgdm, The Sprott Gold Miners ETF.
Open up to date chart in another window.
(opens in a new tab)
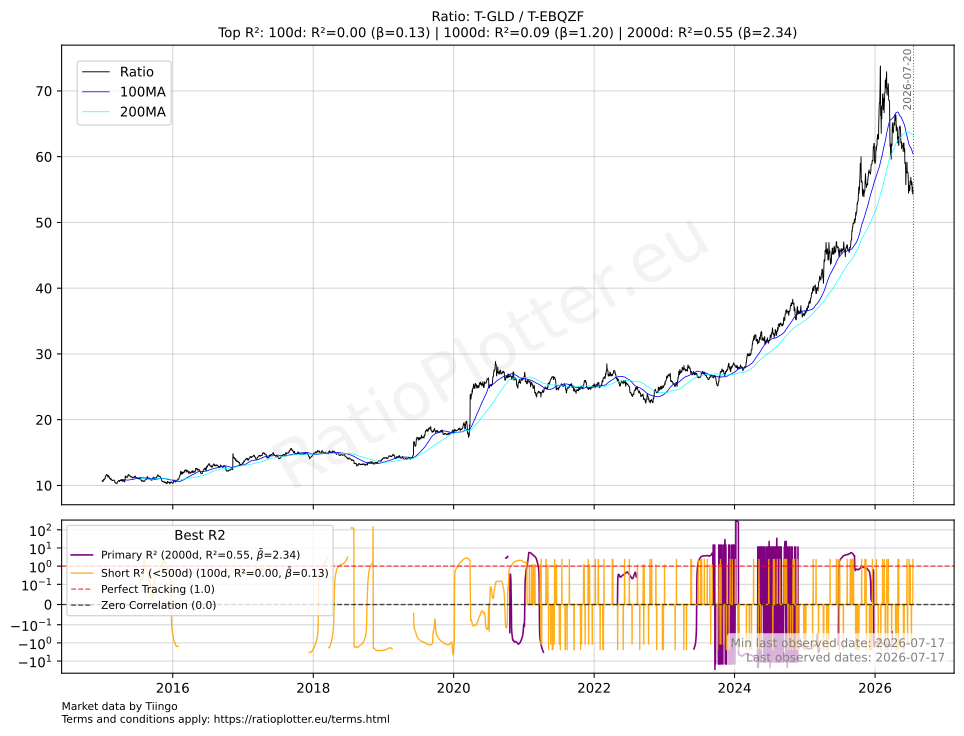
The above either show that gold is too expensive, or land is too cheap. I would say both, you can use our tools to compare gold to the market or to a basket of commodities. Actually let's do that below.
The ratio of Gold (T-GLD) to the T-ebqzf - WisdomTree Broad Commodities ETF.
Open up to date chart in another window.
(opens in a new tab)
How About the Ratio of Land Price to Farming Cost Components Such as Oil and Fertilizer?
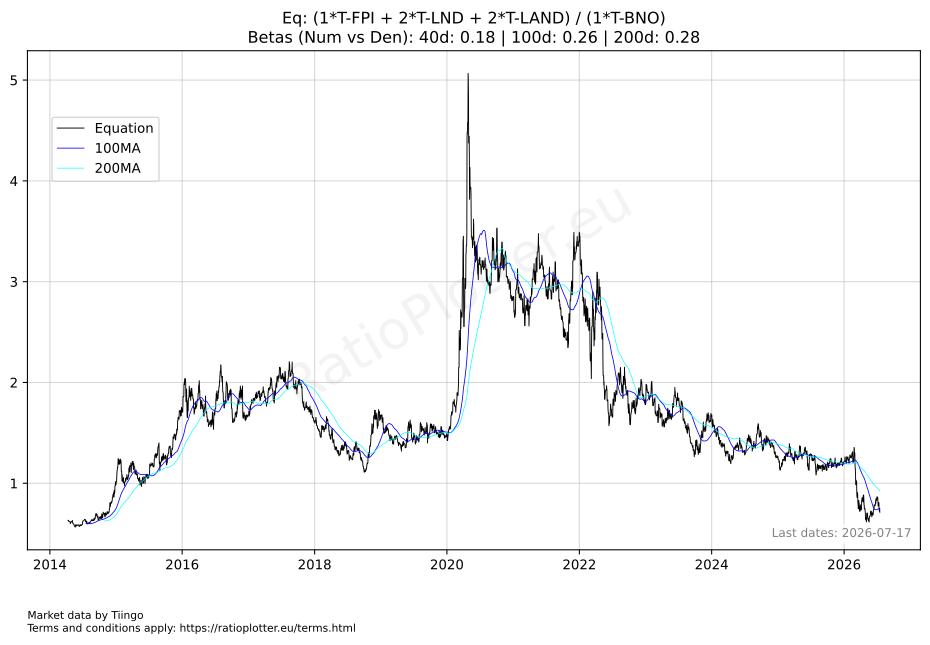
If one is buying land, a good hedge could be to short oil at the peaks such as the Iran war peaks.
Why? As Oil (and Fertilizers that follow oil prices) get expensive, the cost for farmers increase, more farmers
can go bankrupt or near banckrupt and sell their plots of land for less. Thus one can profit on the way down from Oil
and swing those profits to accumulate more land for later selling. Such hedge could be further improved by buying any cheap Fertilizer
company which can be sold to buy more land if we follow the same logic of fertilizer prices going up and land value going down.
Open up to date chart in another window.
(opens in a new tab)
The chart above uses T-BNO, the United States Brent Oil Fund LP.
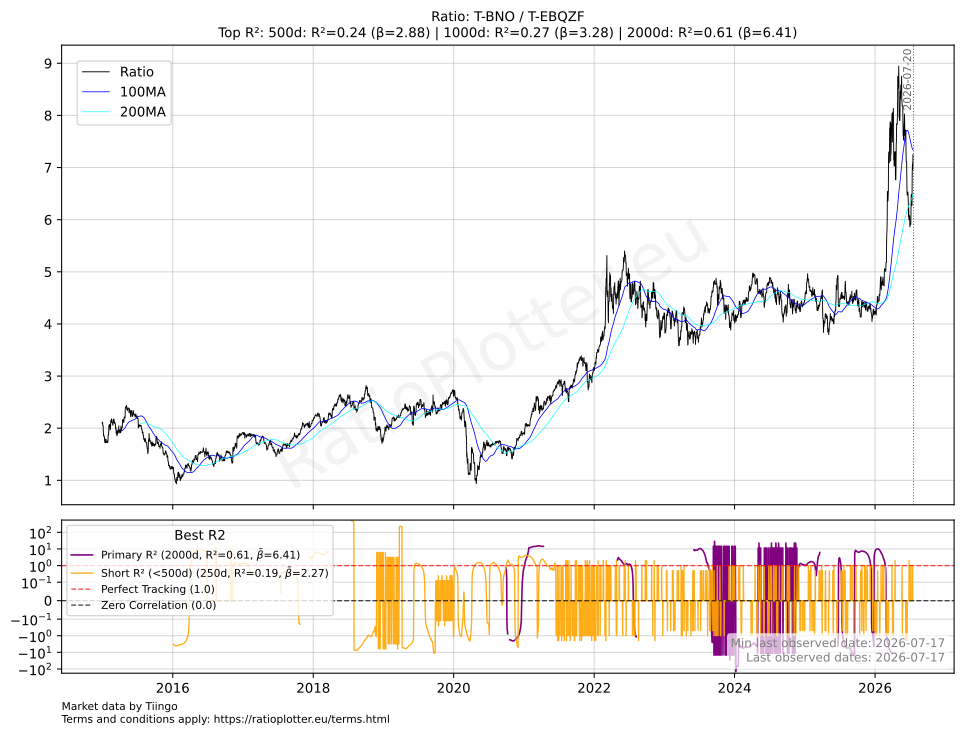
To complete the relative value comparison we plot T-BNO (Crude Oil) against a broad basket of commodities (T-EBQZF). Remember, we are in the electrification age, we may have reached peak oil consumption.
Open up to date chart in another window.
(opens in a new tab)
The chart above uses T-BNO, the United States Brent Oil Fund LP.
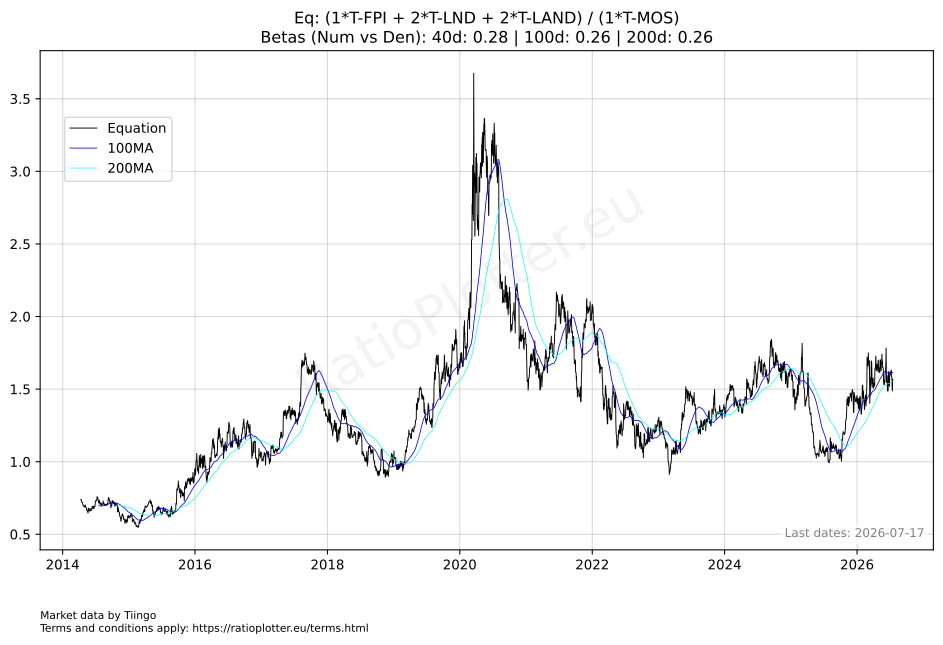
Ratio of Land companies to a Fertilizer Company
It seems that Mosaic (T-MOS) is particularly impacted by the Iran war and perhaps at a good opportunistic price.
Open up to date chart in another window.
(opens in a new tab)
Notice that Mosaic owns Phosphate mines, one of the natural resources we are first running out of (there have been new discoveries, but not enough).
But How Much Would One Such Land Stock Compound if I Reinvest Its Dividends at My Portfolio CAGR?
For answering this question, you can use our financial calculator inputting the historical dividends of for instance BrasilAgro (obtainable from Morningstar) and its sales growth. Ratioplotter.eu financial calculators. Based on our analysis, if your Portfolio yields above 12%, these land stocks would compound below it, even if you reinvest their dividends into tech stocks or similar. This could lead to a scenario of later either rebalancing from the land stocks or using them as collateral. If your portfolio yields below 12%, a basket of BrasilAgro and Glastone at current prices could boost the portfolio CAGR above 12% and be kept in the longer term.
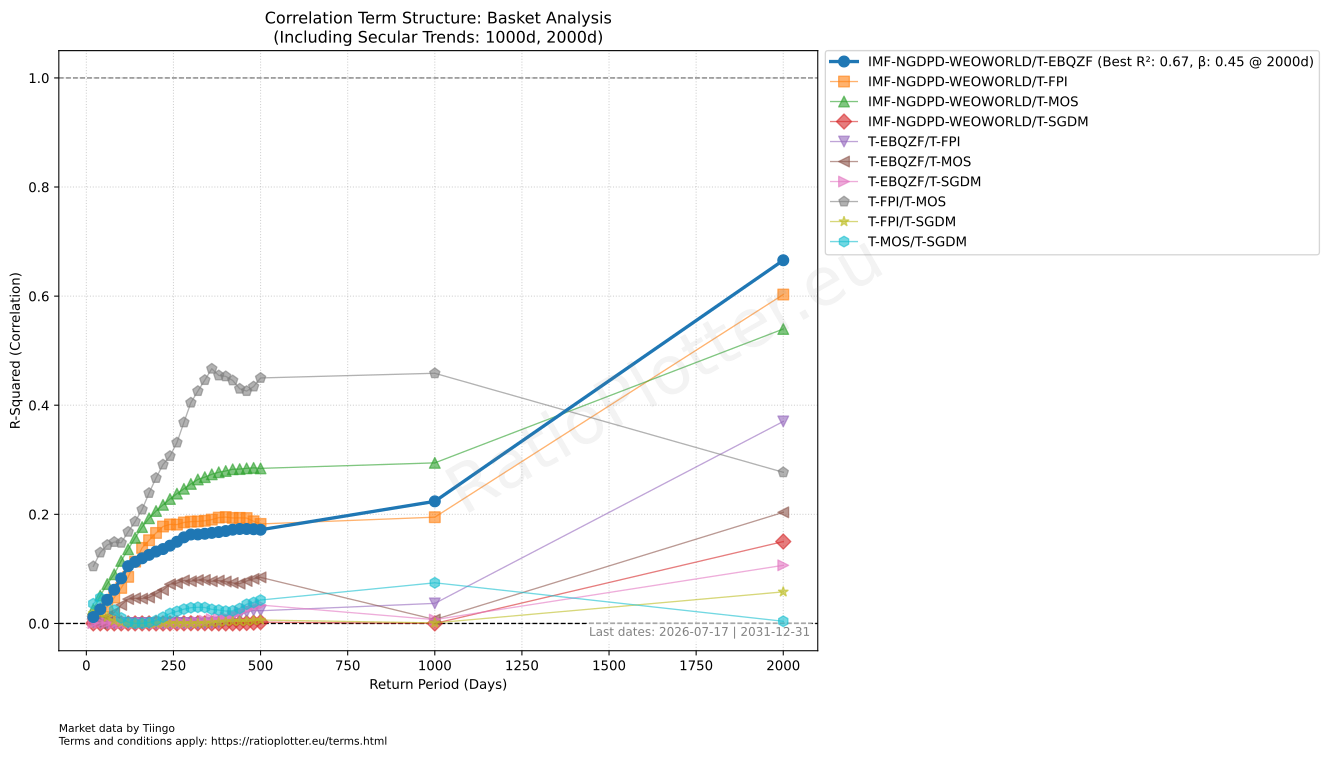
Asset Correlation Analysis Chart
This chart analyzes the R2 correlation among pairs of assets on different terms.
The greater the R2 the more likely the assets will move in tandem over that term
(most betas if not all were positive, you can check them with the ratio plot or equation plot tools).
Open up to date chart in another window.
(opens in a new tab)
Bring Your Own Data Case
Even though we have a vast space of tickers and datasets, we may lack a few statistics.
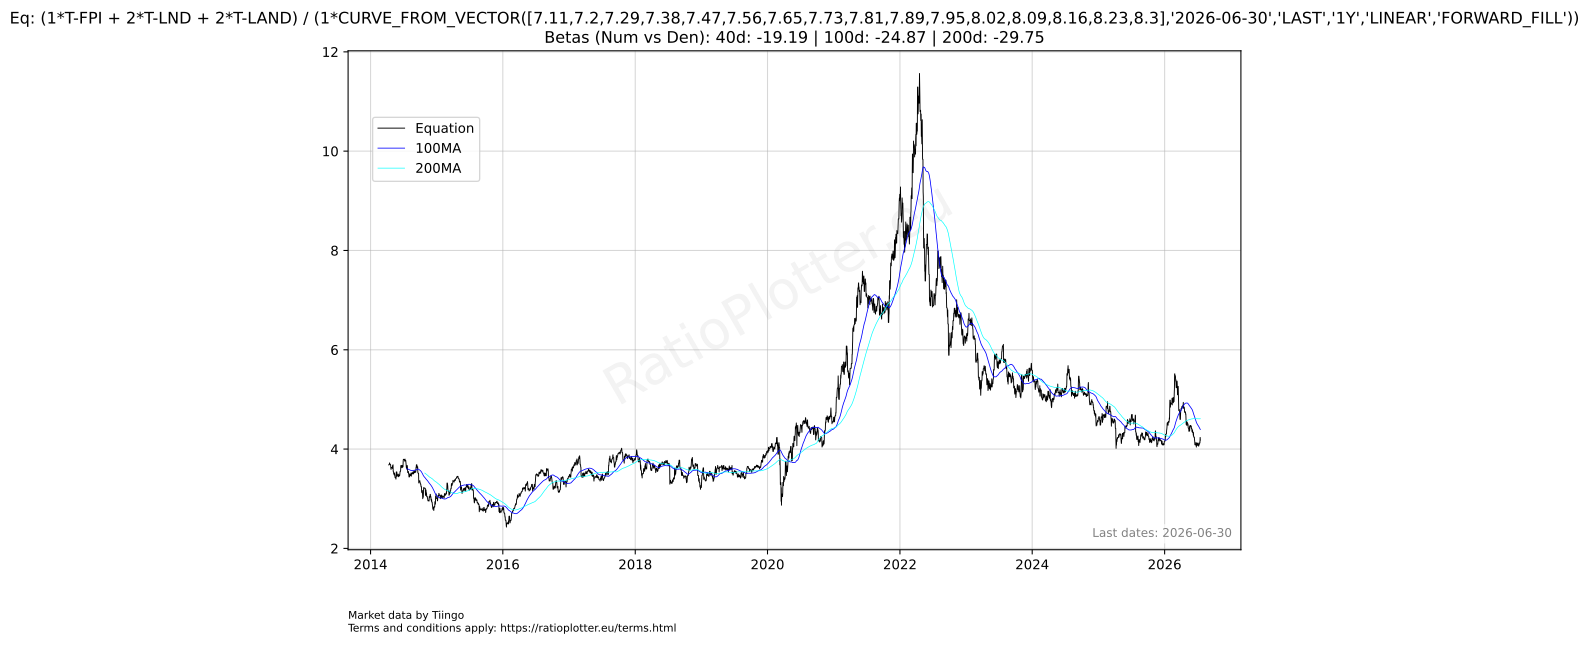
This is not a problem at all as advanced users can bring their own data using the CURVE_TO_VECTOR() function.
We will plot the price of our basket of farm stocks against the world populational growth.
Open up to date chart in another window.
(opens in a new tab)
Actually after further inspection I found the world population series in the WB- ticker space.
This allows us to make the above plot without the CURVE_FROM_VECTOR. Simply use these tickers:
https://ratioplotter.eu/equation_plotter.html?ca=1.0&cb=2&cc=2&cd=1&ta=T-FPI&tb=T-LND&tc=T-LAND&td=WB-WB_WDI_SP_POP_TOTL-WLD