Warren Buffett's company, Berkshire Hathaway, began buying Coca-Cola stock in 1988. He heavily accumulated shares following the 1987 stock market crash, eventually investing over $1 billion by 1989. This remains one of his most iconic and longest-held investments. Our simulation below shows that such initial investment would have multiplied 100x as of today.
And it is not that Coca-Cola was a star company, it was more of a star investment. Back in the 1980s and 1990s, IBM already existed as a company dealing with much more complex technology with higher growth potential. And by that time, Pepsi was already competing with Coca-Cola!
This article uses a simulation function from ratioplotter.eu to simulate Warren Buffett reinvesting the dividends of a Coca Cola position acquired 1st of Jan 1990 (a price slightly higher than all prices Buffett paid the years before).
We have created a wizard page (opens in a new tab) that allows you to simulate the reinvestment of dividends paid by stocks in your portfolio. If you want to learn about not only simulating past dividends being reinvested, but estimating current dividend yields and projecting future dividends check these two other pages: estimating present dividend yield and forecasting future dividends pays (opens in a new tab) and calculating how much a stock will compound in the future if its dividends are reinvested at a certain rate of return (opens in a new tab) .
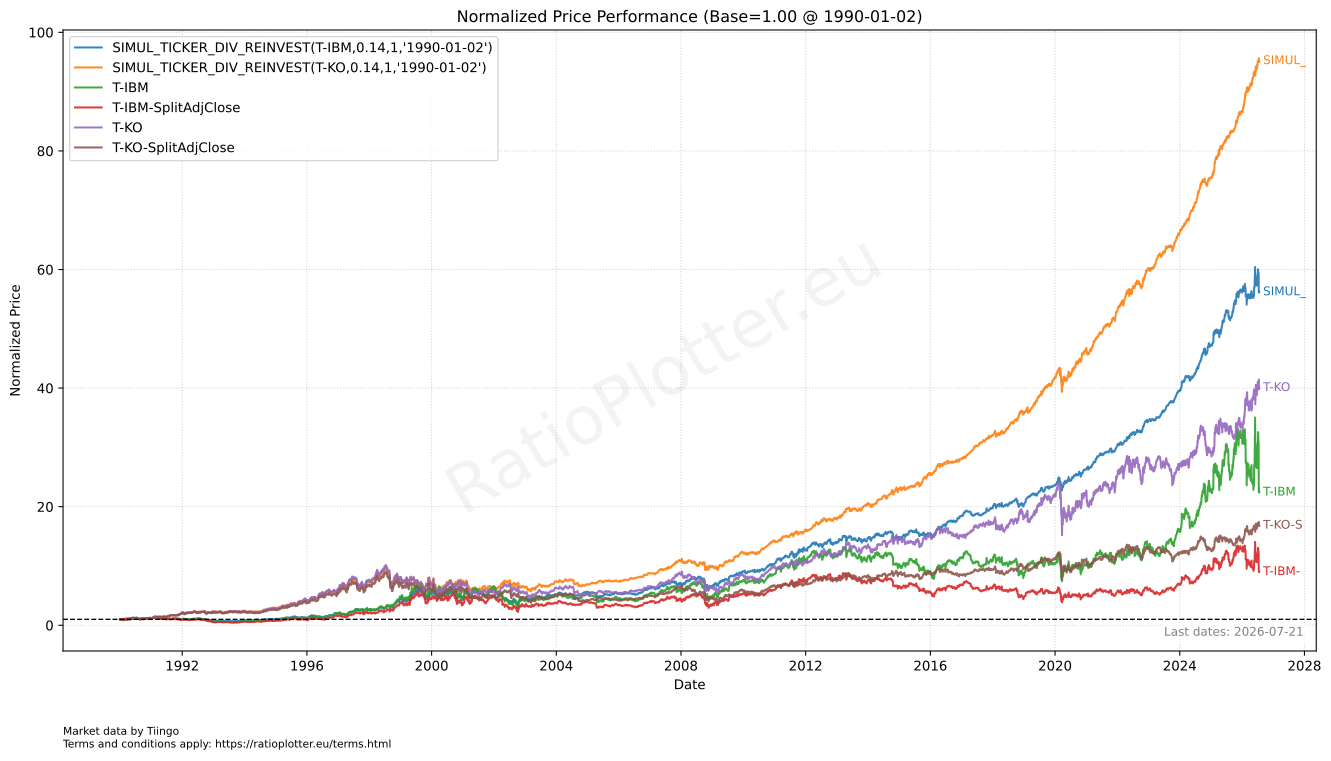
On the top orange and blue curves, we simulate that the Coca-Cola and IBM dividends were reinvested at a 14% CAGR (Compound Annual Growth Rate), actually at the daily growth corresponding to that yearly CAGR. Why 14%/year? Off the top of my head I have measured Berkshire stock price to go up on average 15% per year for the last decades (not discounting inflation, the whole article does not take inflation into account). Since Berkshire does not pay dividends, one can assume that if it has been priced fairly over the decades it compounds at around 15% per year, way above the S&P for instance. Notice on the chart below how Coca-Cola (Orange curve) grew near 100x and was a better investment than IBM (Blue) which grew below 60x, both considering the dividends were reinvested at 14% per year (actually we do the equivalent rate daily as Warren would not stop investing and rebalancing every dividend he obtained).
In Purple and Green we have the scenarios for investing the Coca-Cola dividend in Coca-Cola itself (Purple) and investing the IBM dividends in IBM itself (Green). Coca-Cola reaches a bit above 40x and IBM fell recently almost touching the 20x growth in the same period.
Finally in Brown and Red at the bottom of the chart we have the scenario of just buying a 1$ fractional share of each and using the dividends to cover your daily costs such as rental, food. That is what many retirees do with their portfolio dividends.
It turns out Coca-Cola was a better investment in all scenarios! We discuss why below the charts, which speak for themselves.
Chart: comparing an investment of 1 Dollar in Coca-Cola with the same on IBM, both starting by 1990-01-01, and both reinvesting the dividends at 14% CAGR.
Example function for your use in copying, pasting, adapting: SIMUL_TICKER_DIV_REINVEST(T-KO,0.14,1,'1990-01-02')
Re-generate an up-to-date chart.
The Coca-Cola simulated investment curve in orange colour is the overall winner.
This curve simulates the investment of 1$ in Coca-Cola by 1990-01-01 with the dividends reinvested
at 14% per year.
In other words: this simulates reinvesting dividends into Berkshire's overall compounding rate
rather than directly back into KO stock.
What is to be Learned from The Above Charts?
I write down my lessons learned from the above, they are not necessarily the truth, they are my truth, my interpretation of the facts. Every investor should make their own interpretation and make decisions at their own risk.
From the above I learn that:
- Warren Buffett is a great investor. Why? It is easy to make good decisions looking back at the data like we do here. But back in 1990, many would have said that a technology company like IBM would have fared better, yet Buffett invested in Coca-Cola. Why? See next.
- It is important to think independently and do the fundamental analysis. Warren Buffett knew Coca-Cola had enough cash to either grow or increase the dividends. Warren Buffett's Berkshire Hathaway obtained an initial dividend yield of approximately 3% to 4% on its Coca-Cola position when the stock was purchased between 1988 and 1989. Because Coca-Cola has continuously increased its payouts over the decades, Berkshire's yield-on-cost—the annual dividend divided by the original purchase price of about $3.25 per share—has skyrocketed to well over 50%.
- A tool like our simulation tool can tell how much your long standing positions are compounding and which one is the winner among them so you do not cut the winner by mistake. But in order to pick the right stock to start with, such simulation looking at past data will not necessarily help, for deciding which position to start one needs to look at fundamental analysis to see for instance that the stock is cheap in relation to its sales growth rate or dividend payment capacity, not necessarily currently paid dividends.
- One is not obliged to reinvest the dividends on the company that paid them as a matter of fact we see a worse result from that in the chart.
- A stable company like Coca-Cola, even with competitors (Pepsi was present all the way); paying good dividends; and with a timeless product; may be a better investment than a technology company which may have its high-upfront investment products disrupted or belonging to technology museum.
- One should not underestimate the power of compounding your returns.
- One should not underestimate the power of dividends. Tech companies often do not pay dividends as they invest in their own growth. As long as that growth manifests it is all fine, the problem starts when the tech company invests to be 3rd, 4th place in a world where the winners take it all (tech).
- It is hard to compare growth versus dividend companies unless one can simulate the results of reinvesting dividends.
Have you enjoyed this story and are becoming a fan of Warren Buffett? I suggest you browse the Buffett indicator page of our site for more insights. Notice that this article helps plotting returns in retrospect for past dividends. If you want to do forward looking simulations of dividend reinvestment I suggest you look at our: financial calculators.