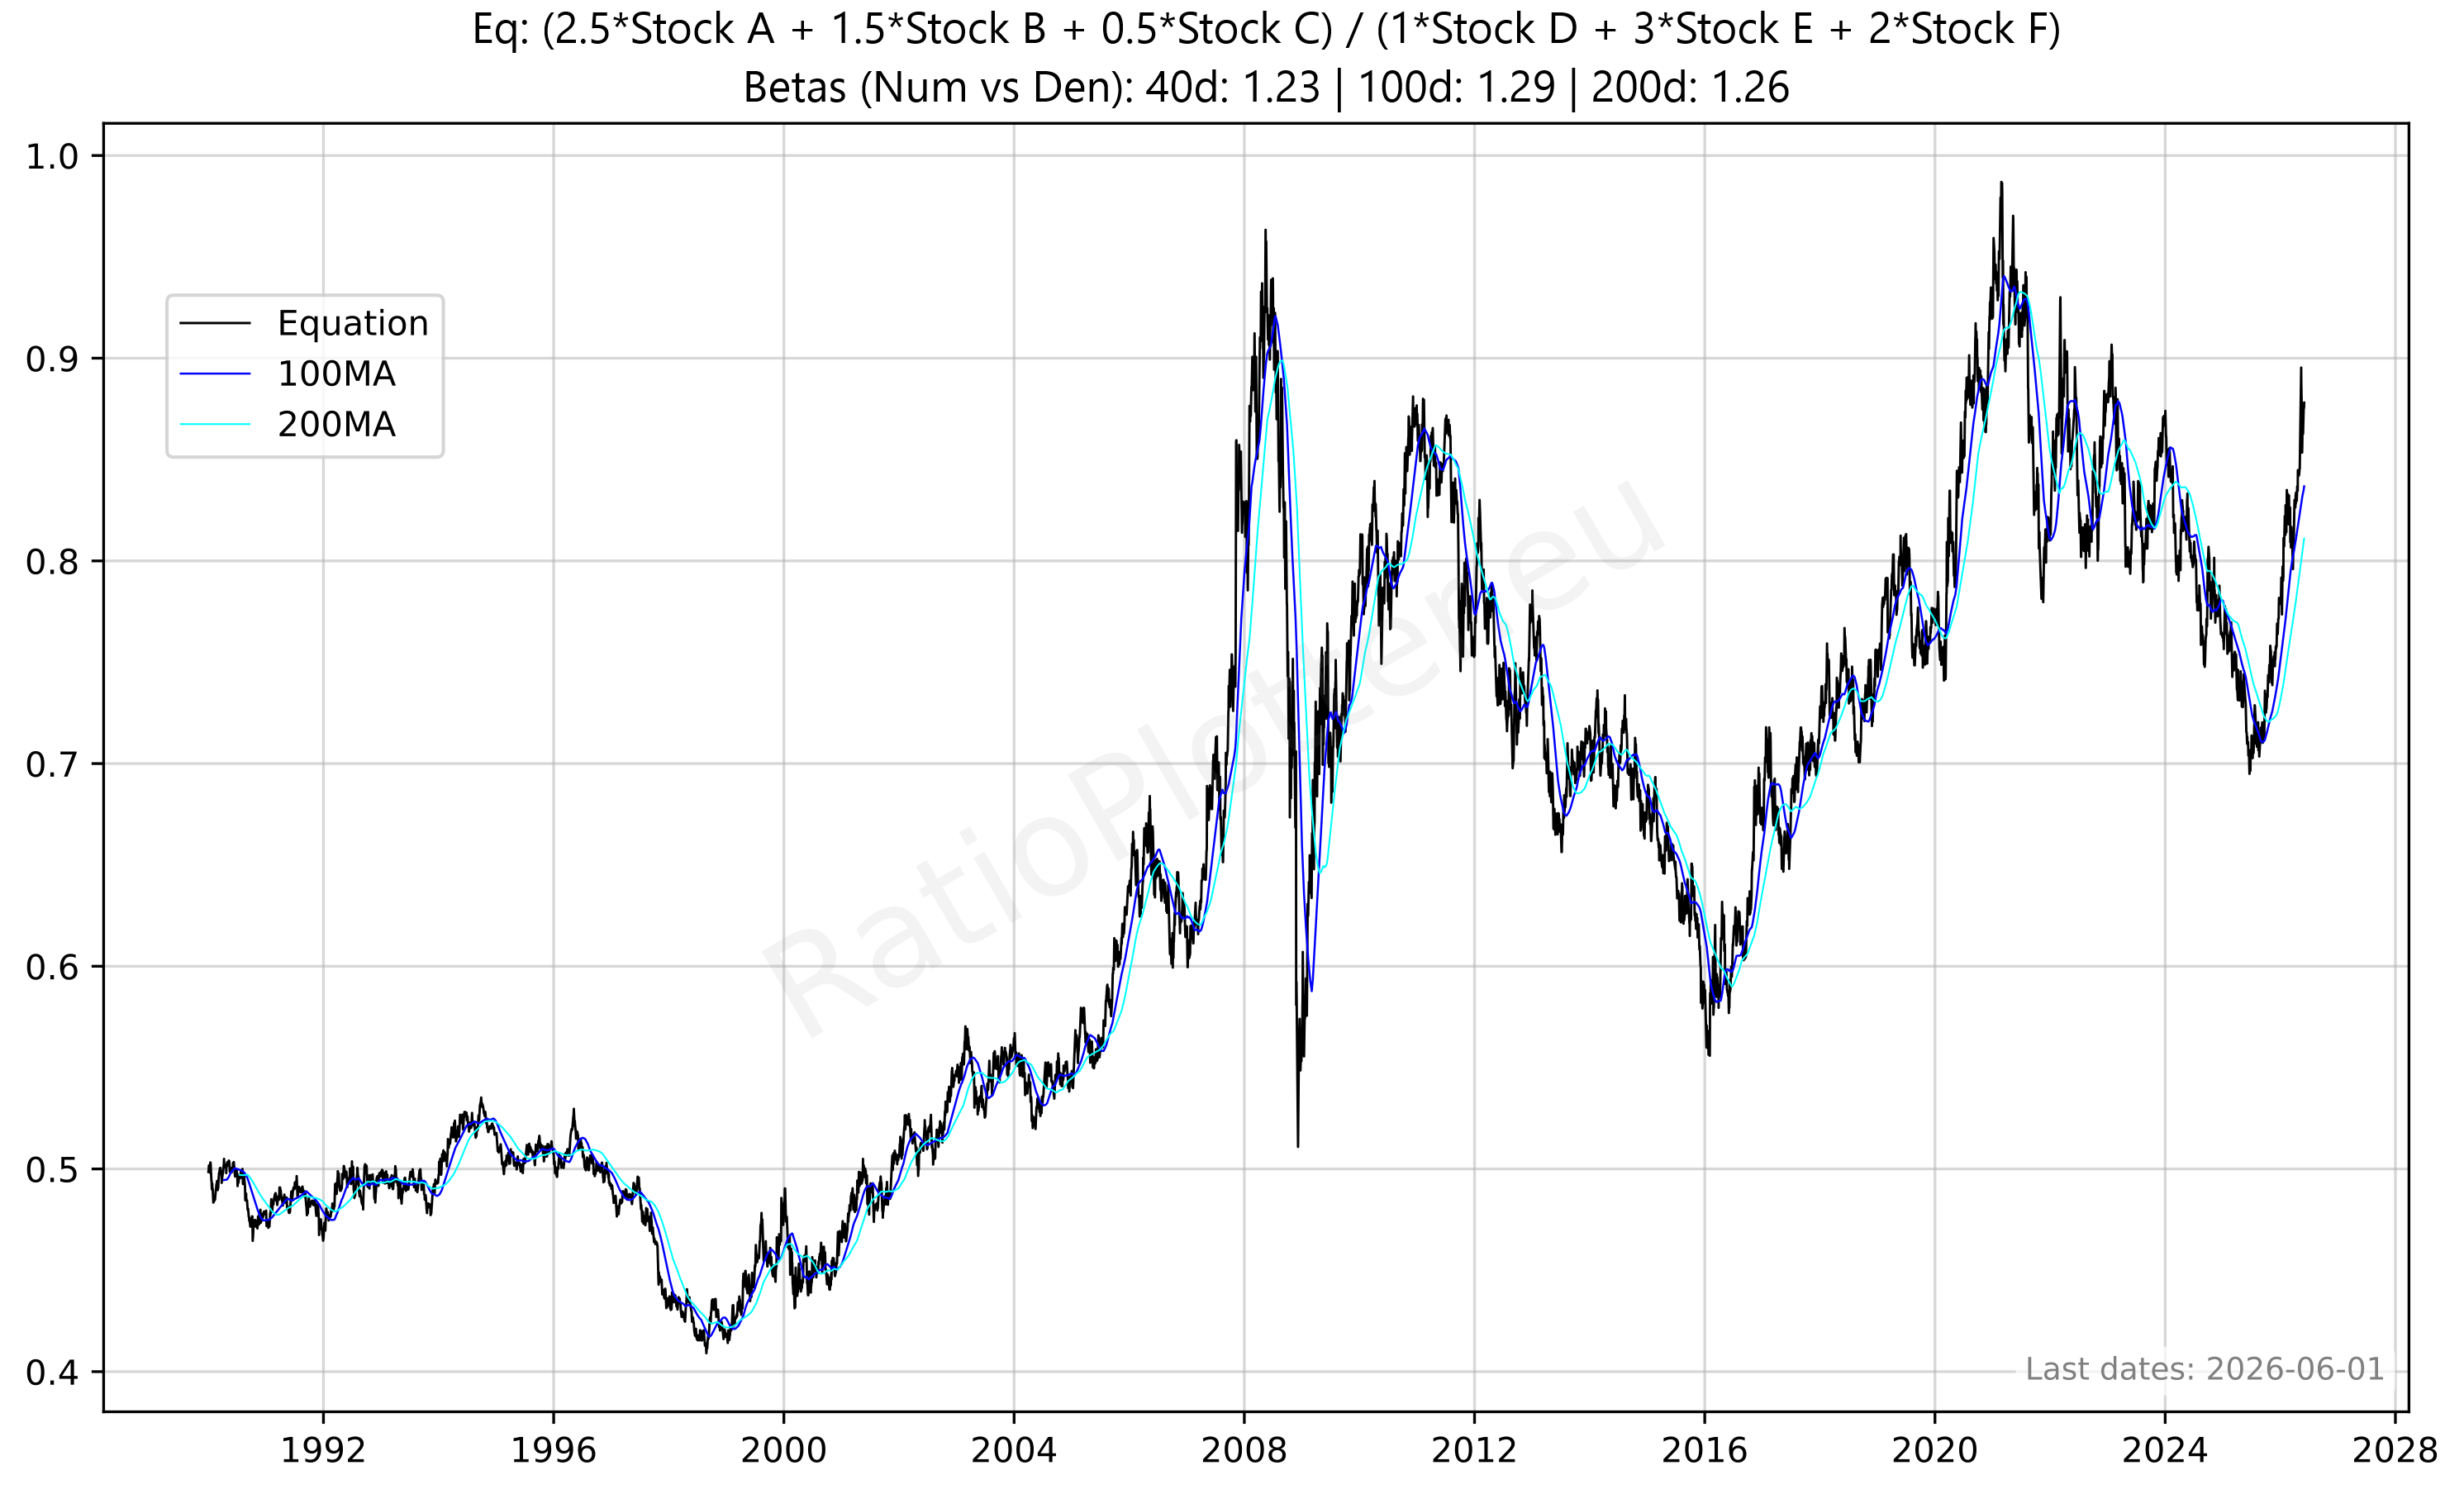
Plot Custom Equation
Enter tickers and coefficients (e.g., 1.0*GLD + 0.5*SLV - 1.0*USO)
Suggested Equations (Free Tier)
Notes & Guidelines
This tool evaluates the ratio spread (Numerator / Denominator) and tracks their structural relationship (Rolling Beta and R²). It does not regress the final curve against time. If you want to compute a strict time-trend regression on a custom equation, build the formula manually using
REGRESSION(RAT(LINEAR_COMBINATION(...), LINEAR_COMBINATION(...))) and plot it directly on either the Flexible Single Regression Plotter or the Create a portfolio tool.
Logic: This tool calculates a custom index. The formula is:
Coefficients: Must be numbers (e.g., 0.5, -1, 100). If you want to subtract a ticker, use a negative coefficient. Notice in the formula that the coefficients used can alter the results of the plotted chart significantly. For the free version we have hardcoded the coefficients we think are best, but this may be flawed. To fix this you will be able to change the coefficients to your liking when we release the paid version of RatioPlotter with no limits.
Tickers: Use valid standardized financial tickers. If a field is left empty or coefficient is 0, that term is ignored.
Currency: Ensure tickers are in the same currency or the result may be distorted by exchange rates.
Example: 1.0*GLD + 0.5*SLV - 1.0*USO creates a synthetic asset that is long gold, partially long silver, and short oil.
Recommendation: Use this tool to create custom baskets or hedged positions for analysis.
Ticker Data Usage, Data Sourcing and Ticker Functions
Ticker Data Sources
Default Ticker Column Projections & Adjustments
ADD() Element-wise adding
ADD(T-AAPL, T-MSFT) or ADD(T-GLD, 10.5).
CLOSE_GAPS() Interpolating and extrapolating sparse data
CLOSE_GAPS(ES-teicp000-coicop18, 'LINEAR', 'FORWARD_FILL', 60).
Our tickers are all by default forward filled in their gaps (non-data non-trading days), except for IMF- tickers
which are linearly interpolated and for ES- tickers which do not have their gaps closed at all. To change the
default gap closing applied, simply wrap the ticker in CLOSE_GAPS to apply a new strategy to close the data gaps.
For instance FED-WPU53 is by default forward-filled, to change it to linear interpolated with zero days extrapolated,
write it as:
CLOSE_GAPS(FED-WPU53, 'LINEAR', 'LINEAR', 0)
CURVE_FROM_VECTOR() Custom data vectors
CURVE_FROM_VECTOR([198.27, 211.92, 245.12, 281.72, 318.27], '2026-06-30', 'last', '1y', 'linear', 'forward_fill').
Arguments represent the array of values, anchor date, anchor position ('first' or 'last'), frequency ('1y', '1q', '1m'), interpolation ('linear', 'forward_fill'), and extrapolation ('none', 'forward_fill', 'linear').
LAG() Time-shifted underlying vector
LAG(T-AAPL, 10). It is highly useful for autocorrelation studies.
LINEAR_COMBINATION() Weighted sum of multiple vectors
LINEAR_COMBINATION([1.5, -0.5], [T-AAPL, T-MSFT]).
LOG() Logarithmic transformation
LOG(T-GOOGL, 2) or LOG(T-MSFT, 10). If you want you can use EPSILON constant which is not a natural logarithm constant, but just a logarithm on a tiny base: LOG(T-SPY, EPSILON). We encourage using LOG on the base two as it is the fastest to compute for you and will allow caching of the computation for others to benefit.
The LOG on base 2 will also mean you are measuring how long it takes for the time series to double, a difference in 1 point is a doubling.
LOOK_FORWARD() Shifting data forward in time
LOOK_FORWARD(T-AAPL, 30).
The second argument 30 is the number of days to look forward. All our data for time series is measured in days.
MATH- Custom Mathematical Tickers
MINUS() Element-wise subtraction
MINUS(T-AAPL, T-MSFT).
MOVING_AVERAGE() Trailing Simple Moving Average
MOVING_AVERAGE(T-SPY, 200) calculates the 200-day trailing moving average.
MULT() Element-wise multiplication
MULT(T-COM, T-USDCHF)
performs a currency conversion of the T-COM broad commodity investment basket to Swiss Francs (most of our tickers are in USD and that
ticker price currency can be seen on the ticker selector page). T-COM is the: DIREXION AUSPICE BROAD COMMODITY STRATEGY ETF.
RAT() Calculating Ratio Between Two Tickers
RAT(T-AAPL, T-MSFT). Example of comparing Google's outperformance to an idealized
CAGR curve: RAT(T-GOOGL,T-MSFT)/MATH-CAGR_PCT-2 (requires login with Google).
REGRESSION() and RESIDUALS() Functions
(1) The REGRESSION or RESIDUAL functions are reserved for paying users, apart from the free tier REGRESSION examples present on the log plot page.
(2) When the REGRESSION() function is the outermost function of the expression and is used on the log plotter, it will cause a nice regression plot canvas to display the fitting line and useful regression statistics such as ADF probability and R².
If used on the regular ratio plotter page, it will plot the residuals vector. Example: REGRESSION(LOG(T-URTH,2)) (this example requires subscription as it uses the LOG function).
The REGRESSION function is very good at modelling time series that grow following a linear trend. Most financial assets grow following an exponential trend, which means that if we apply the LOG function to this asset ticker we obtain a linear trend which can be modelled by the REGRESSION function. Try it, try plotting just LOG(T-GOOGL) to see this straight line tendency.
RET() Rolling Percentage Return
RET(T-SPY, 30)
measures the rolling 30-day percentage performance. The return for a day is always measured looking back
at the last x days (30 in the example), otherwise we would introduce look-ahead bias into our models of returns.
To calculate forward returns you can combine the two functions RET(LOOK_FORWARD(T-GOOGL,30),30). Easy right?
ROLLING_SLOPE() Calculating slope, velocity, or derivating
ROLLING_SLOPE(IMF-NGDPD-CHN, 400, 1). The second argument (400) is the lookback
window in days to calculate the smoothed slope. The third argument (1) determines the scalar output
granularity (e.g., 1 for daily velocity, 365 to annualize the velocity).
Example: China GDP Velocity.
SIMUL_TICKER_DIV_REINVEST() Plotting Dividends Reinvested at Your Portfolio Return Rate
SIMUL_TICKER_DIV_REINVEST(T-MSFT,0.25,1,'2022-08-01').
This is a function available only for users with the advanced subscription. The first argument is the
Ticker simulated, the second is your portfolio CAGR rate (in this case 0.25 = 25% yoy, applied dynamically daily).
The third argument is the initial investment in the currency of the stock ticker. The last argument is the
start date. See our article on dividend reinvestment simulation.
VOLATILITY() Annualized Rolling Volatility
VOLATILITY(T-SPY, 50) measures the annualized volatility of
the S&P 500 utilizing a 50-day rolling lookback window. The Scatter plot tool
has some examples of the VOLATILITY function.
Z_SCALE() Z scaling, bringing data to the normal curve Z score scale, normalizing
Z_SCALE(T-MSFT),
Z_SCALE(RAT(T-GLD,T-SLV)), Z_SCALE(ROLLING_SLOPE(T-COM,90,1)). This brings
absolute price vectors or ratios to a standardized Normal Curve (Mean 0, StdDev 1) for macro-economic
cycle alignment. This function is available only for users with the advanced subscription.
The Buffett Indicators Tool allows plotting the Z-Scale spread
of the country ETF price to its GDP figures.
By continuing to use this tool, you agree to our Terms of Service and acknowledge that this data is for educational purposes, not financial advice.