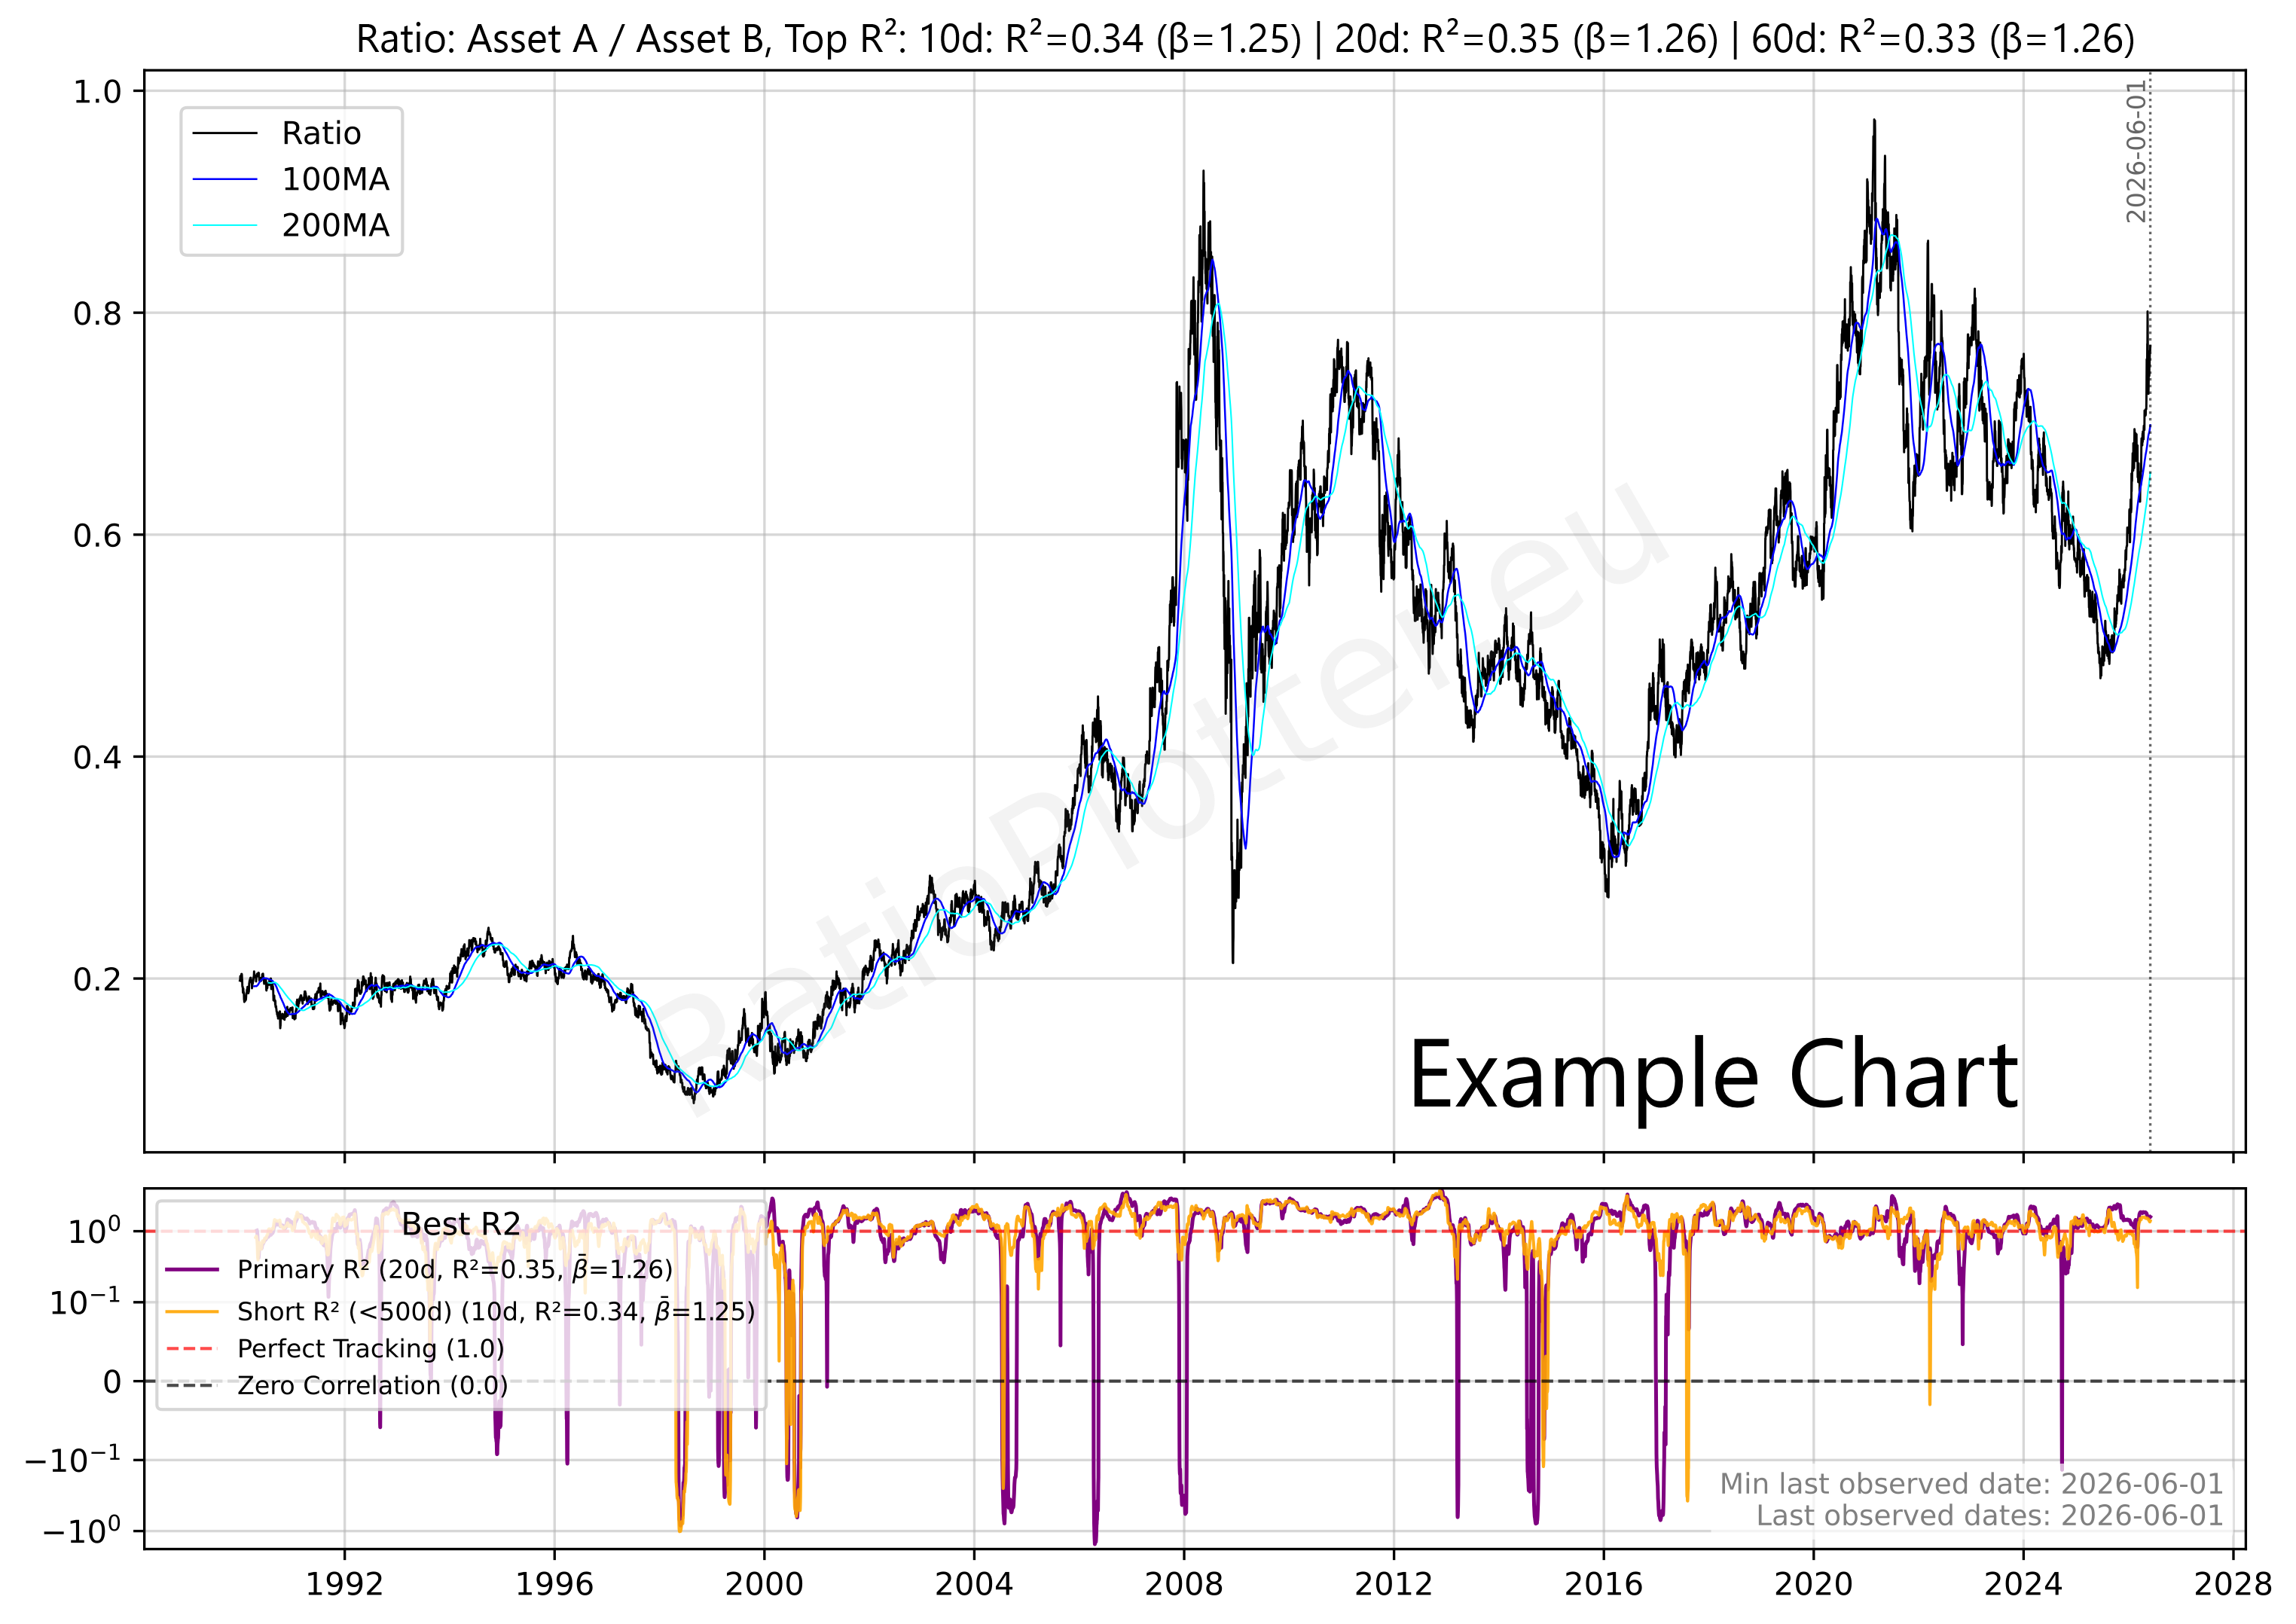
Bring Your Own Data Example
Plot the ratio of a ticker price to X, an arbitrary vector
This page allows you to plot the ratio of a ticker price by its historical and projected estimated earnings, sales, customer base size, etc, this is why we call it Price to X or bring your own data.
You can plot price to earnings (PE) or price to sales (PS) or you can even plot Price to whatever statistics you have as a number sequence (for instance the expected addressable market growth for the company products).
Bring your own data is a " premium feature" reserved for subscribers. For non subscribers this feature/function is only available here when the numerator is T-MSFT.
As a tip. Sometimes I come across beautiful bar charts such as the number of gold projects drilled world wide. And I want to extract that data from the barchart. AI models such as Gemini from Alphabet do a pretty good job of extracting the heights of such bar charts. You just need to type to the AI model: "Have you got a good eye? Are you able to extract the table with the figures, numbers, corresponding to the bar chart image attached? I do not have the original table." Then copy and paste the numbers below and anchor them to an year and you will have an expression you can use anywhere in our system tools.
Where to Obtain The Sales or Earnings Series
Trading Notes & Guide
General Notes
Currency Consistency: Ensure the numerator ticker is in the same currency as the sales, it need not be in the same unit of measurement, but then you will get just the right curve shape and not the right magnitude. See the currency of a ticker on the Ticker Selector Page.
ETF Consistency: When plotting the ratio between two ETF's, always check that both are either distributing or accumulating. If this is not the case dividends can effect the results significantly!
Beta Correlation: Ensure the beta (calculated from montly periodic returns) is significant. Otherwise, you may be trading noise, and there will be no reliable reversal to the mean.
Recommendation: Always check the seasonality plot of the ticker you intend to swing trade; ensure the historical seasonality isn't moving against your position.
R2 and Beta Analysis Summary for Ratio Trading
To ensure a Ratio trade is based on structural correlation rather than random price movement, the R2 and Beta must BOTH be significant.
A low R2 indicates that Asset A and Asset B are "decoupled," meaning any apparent pattern in the Ratio is likely statistical noise with no mathematical pressure to return to the mean. Conversely, a high R2 confirms the assets are "tethered," making mean-reversion strategies reliable.
Besides the R2 we also need to make sure the Beta is healthy. The Beta between two assets indicates how much the numerator moves relative to the denominator. To use the Beta you can use this simple formula: Expected Numerator performance ≈ Denominator performance × Beta value.
A static Beta may mask recent shifts in relative volatility. To ensure your position sizing remains accurate, compare the overall Beta with the rolling Beta windows in the bottom dashboard pane. Monitoring these short-term fluctuations helps distinguish between normal market noise and a fundamental shift in how aggressively one asset moves compared to the other.
Statistical Warning: The R2 Validity Test
The following table defines the boundaries between random noise and actionable correlation based R2 values:
EXTREME CAUTION.
The assets are practically decoupled. No statistical reason for the Ratio to return to the mean.
Assets with a R2 value in this range can be used for diversifying portfolios.
CAUTION.
Significant risk of "drift" where the Ratio diverges permanently from historical averages.
Assets with an R2 value in this range provide little value for both diversification and mean reversion trading.
OPTIMAL.
Assets are tethered. High probability of mean reversion when the Ratio stretches.
Assets with an R2 value in this range are ideal for mean reversion trading.
Statistical Warning: The Beta Validity Test
The following table defines the boundaries between Inverse Ratio, Low volatility and high volatility asset pairs.
ATTENTION.
The assets move in opposite directions. A Beta of -1.0 indicates equal volatility but inverse movement. Assets in this range are primarily used for hedging strategies rather than standard Ratio trading.
EXTREME CAUTION.
The numerator asset is significantly less volatile than the denominator. The ratio will move slowly unless position sizing is adjusted.
Assets with Betas in this range can be used for diversifying portfolios.
OPTIMAL.
Both assets exhibit similar volatility profiles, meaning neither will easily overpower the other during price swings. This balance makes the pair optimal for standard 1:1 ratio trading, allowing for predictable mean reversion without the need for complex position sizing adjustments.
CAUTION.
The numerator is highly volatile relative to the denominator. While the assets may be correlated, this severe imbalance requires careful position sizing to prevent the numerator from overpowering the trade.
*Note: RatioPlotter.eu uses periodic returns (relative changes) to ensure the Beta and R2 reflect the structural relationship regardless of the absolute currency price of the assets.
Ticker Data Usage and Sourcing
Ticker Data Sources
RAT() Ticker function
LAG() Ticker function
MATH- Tickers
CURVE_FROM_VECTOR()
CURVE_FROM_VECTOR([198.27, 211.92, 245.12, 281.72, 318.27], '2026-06-30', 'last', '1y', 'linear', 'forward_fill')
The first argument is the time ordered list of data points, separated by commas. The second argument ('2026-06-30') is the one data anchor we need to plot these values over time.
The third argument ('last') tells the system to apply the anchor date to the last value, another value for this parameter is 'first'.
The '1y' tells the values fall on the exact same date on each year (or closest if leap year).
The '1y' could also be '1q' or '1m' for quarter or month. The same considerations made for year apply.
The 'linear' parameter tells the system how to interpolate the values for days in between the value data points given, another possible value here is 'forward_fill'.
The 'forward_fill' last parameter is about the extrapolation, its possible values are: 'none', 'forward_fill', 'linear'.
Default Ticker Column Projections & Adjustments
Plotting Dividends Reinvested at Your Portfolio Return Rate
This is a function available only for users with the advanced subscription. The first argument is the Ticker simulated, the second is your portfolio CAGR rate (in this case 0.25 = 25% yoy). We apply the daily equivalent rate though. The third argument is the initial investment in the currency of the stock ticker. The last argument is the start date. For a full example see our article on dividend reinvestment simulation or our article looking back at Warren Buffet's investment in Coca-Cola and the results of its juicy dividends.
Calculating slope, velocity, or derivating (these are all synonyms)
Z scaling, bringing data to the normal curve Z score scale, normalizing
This is a function available only for users with the advanced subscription. The single argument can be a Ticker or another vector function. For a full example see our macro quadrant plot.