
Ticker Correlation Matrix
Enter 2 to 5 tickers to generate a pairwise R2 correlation matrix.
Popular Baskets
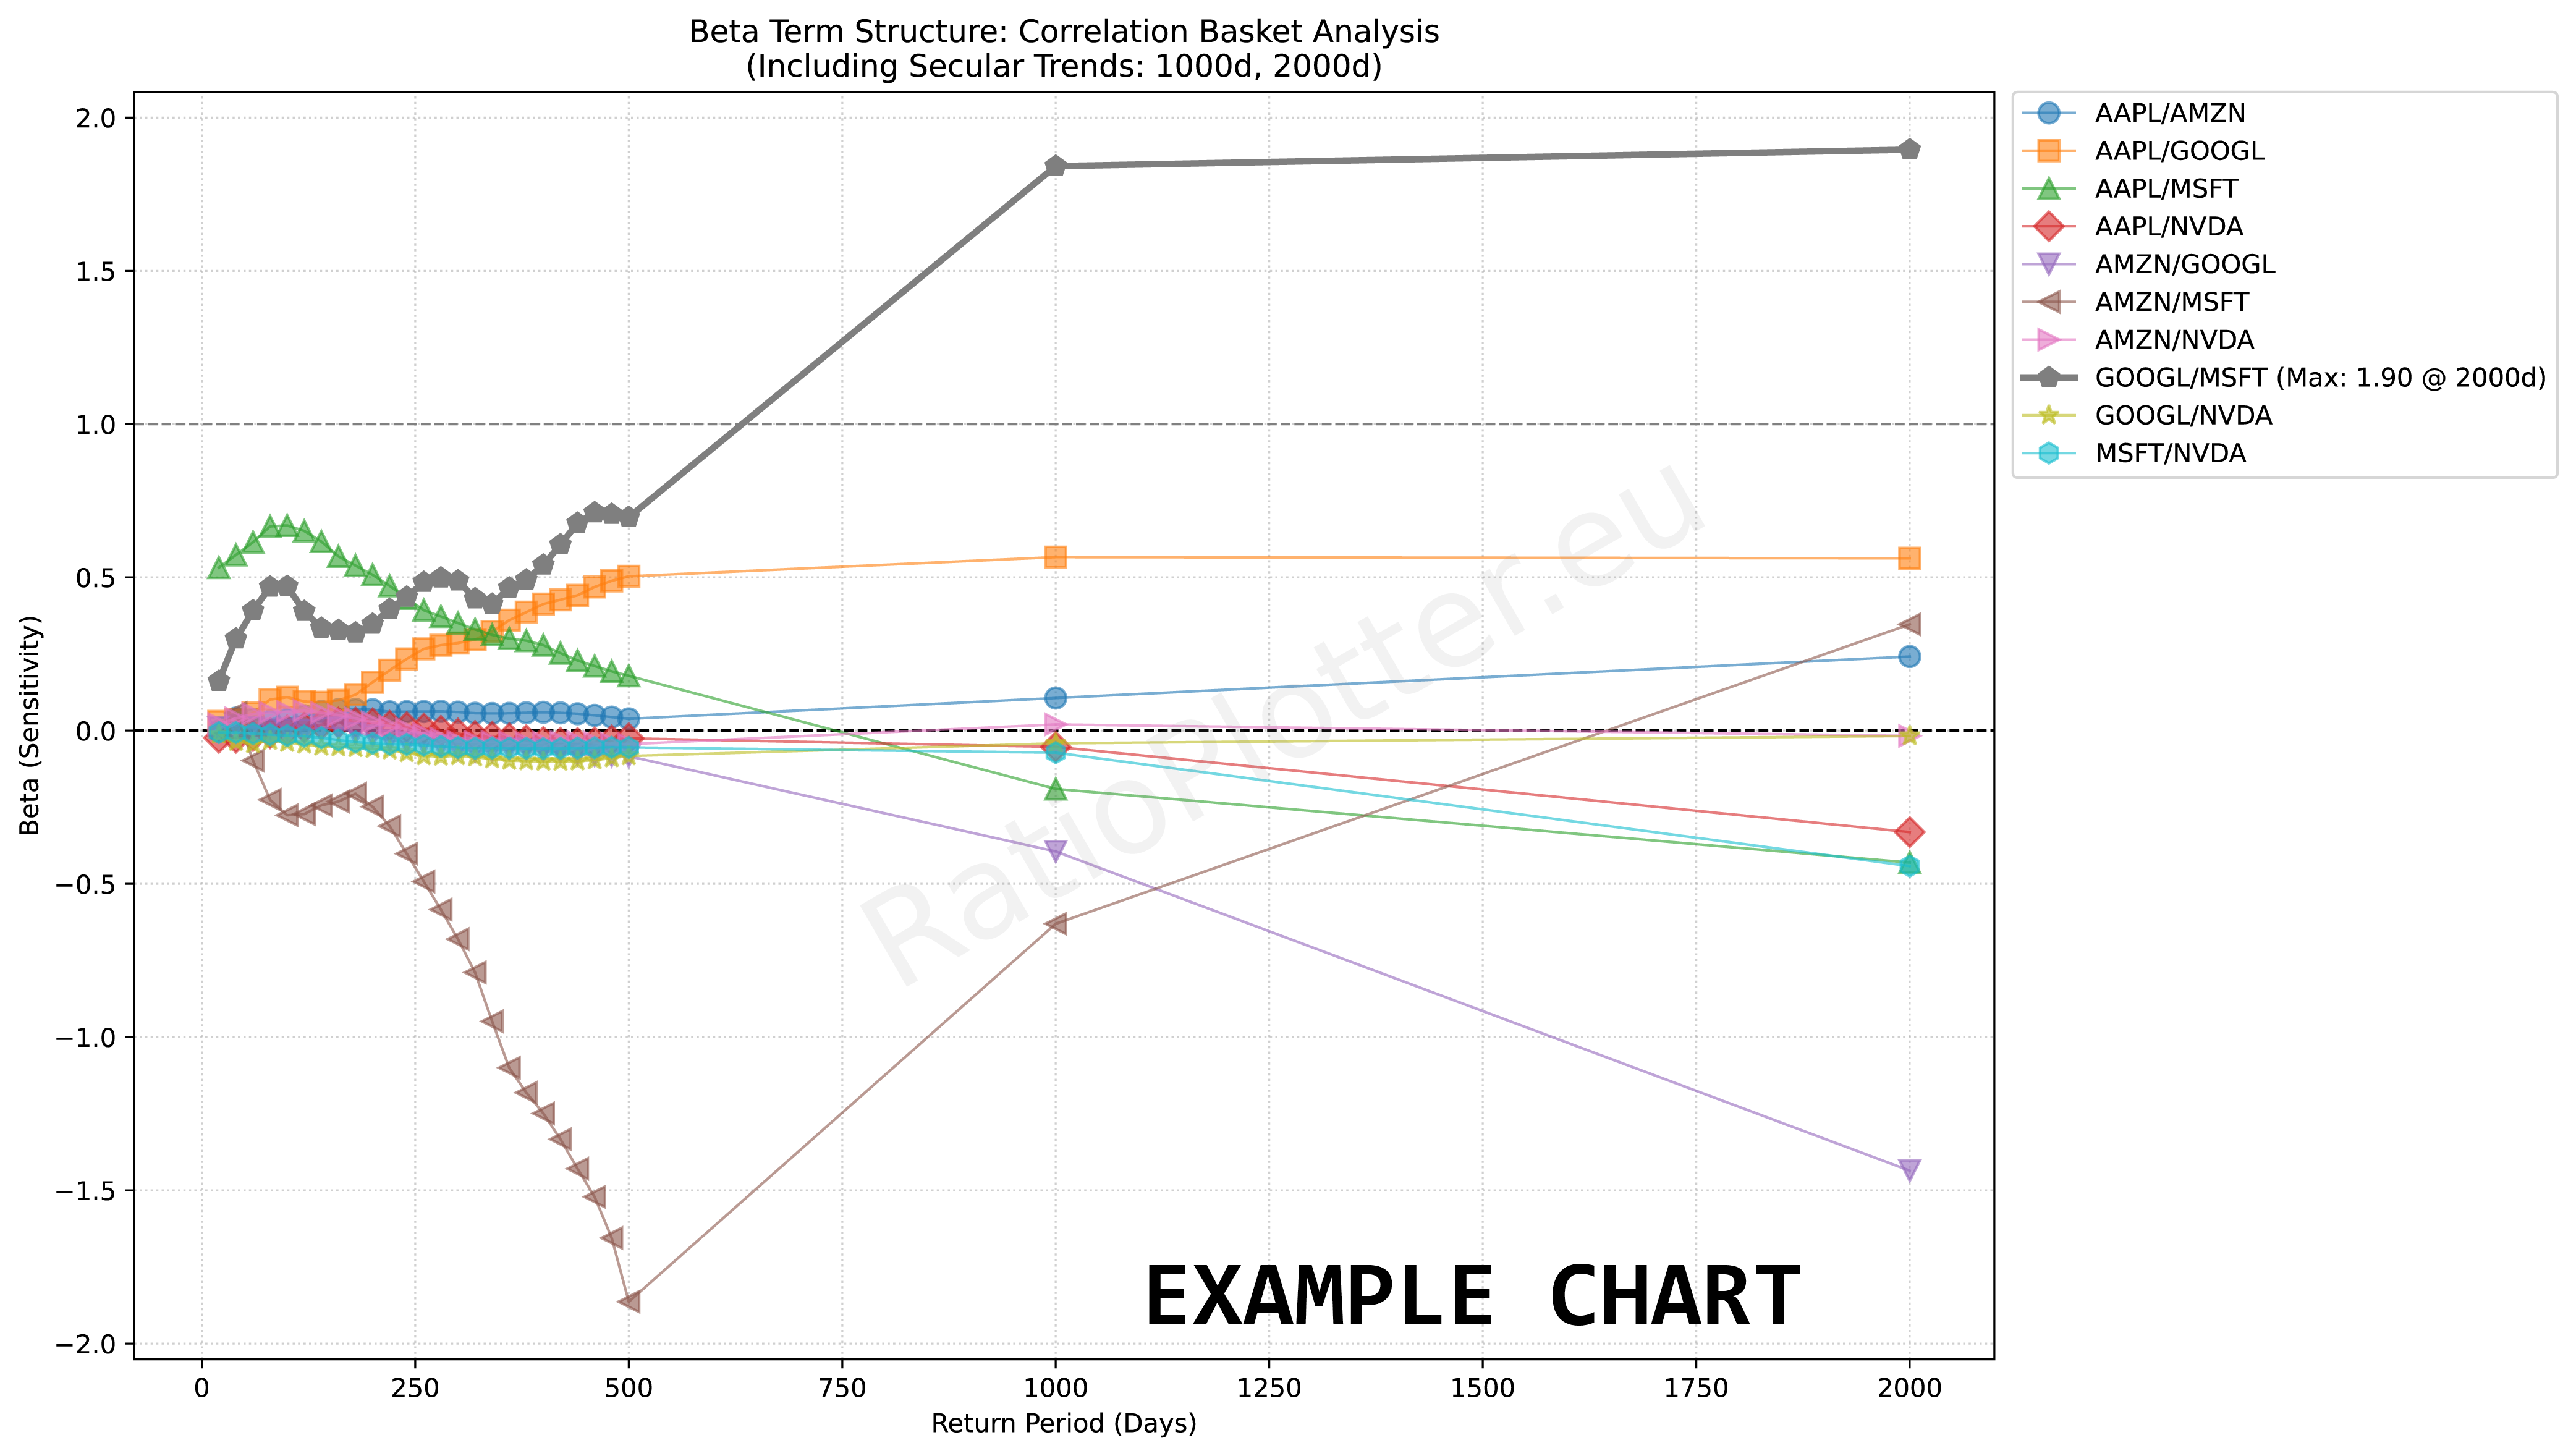
R2 and Beta
This tool calculates the R2 between every pair of assets in the given basket. While R2 measures the strength of the relationship, Beta is provided for the strongest correlations to indicate price sensitivity.
The movements of these assets are largely independent. Low R2 values indicate that one asset's returns do not explain the other's, making them ideal for broad portfolio diversification.
The assets show a partial statistical connection. This range suggests a "weak link" where trends may occasionally align, but the relationship is not reliable enough for precise mean reversion or tight hedging.
These assets are highly correlated. A high R2 indicates that the returns of one asset are a strong predictor of the other. These pairs are optimal for mean reversion trading and highly effective hedging strategies.