
Multi-Ticker Overlay Analysis
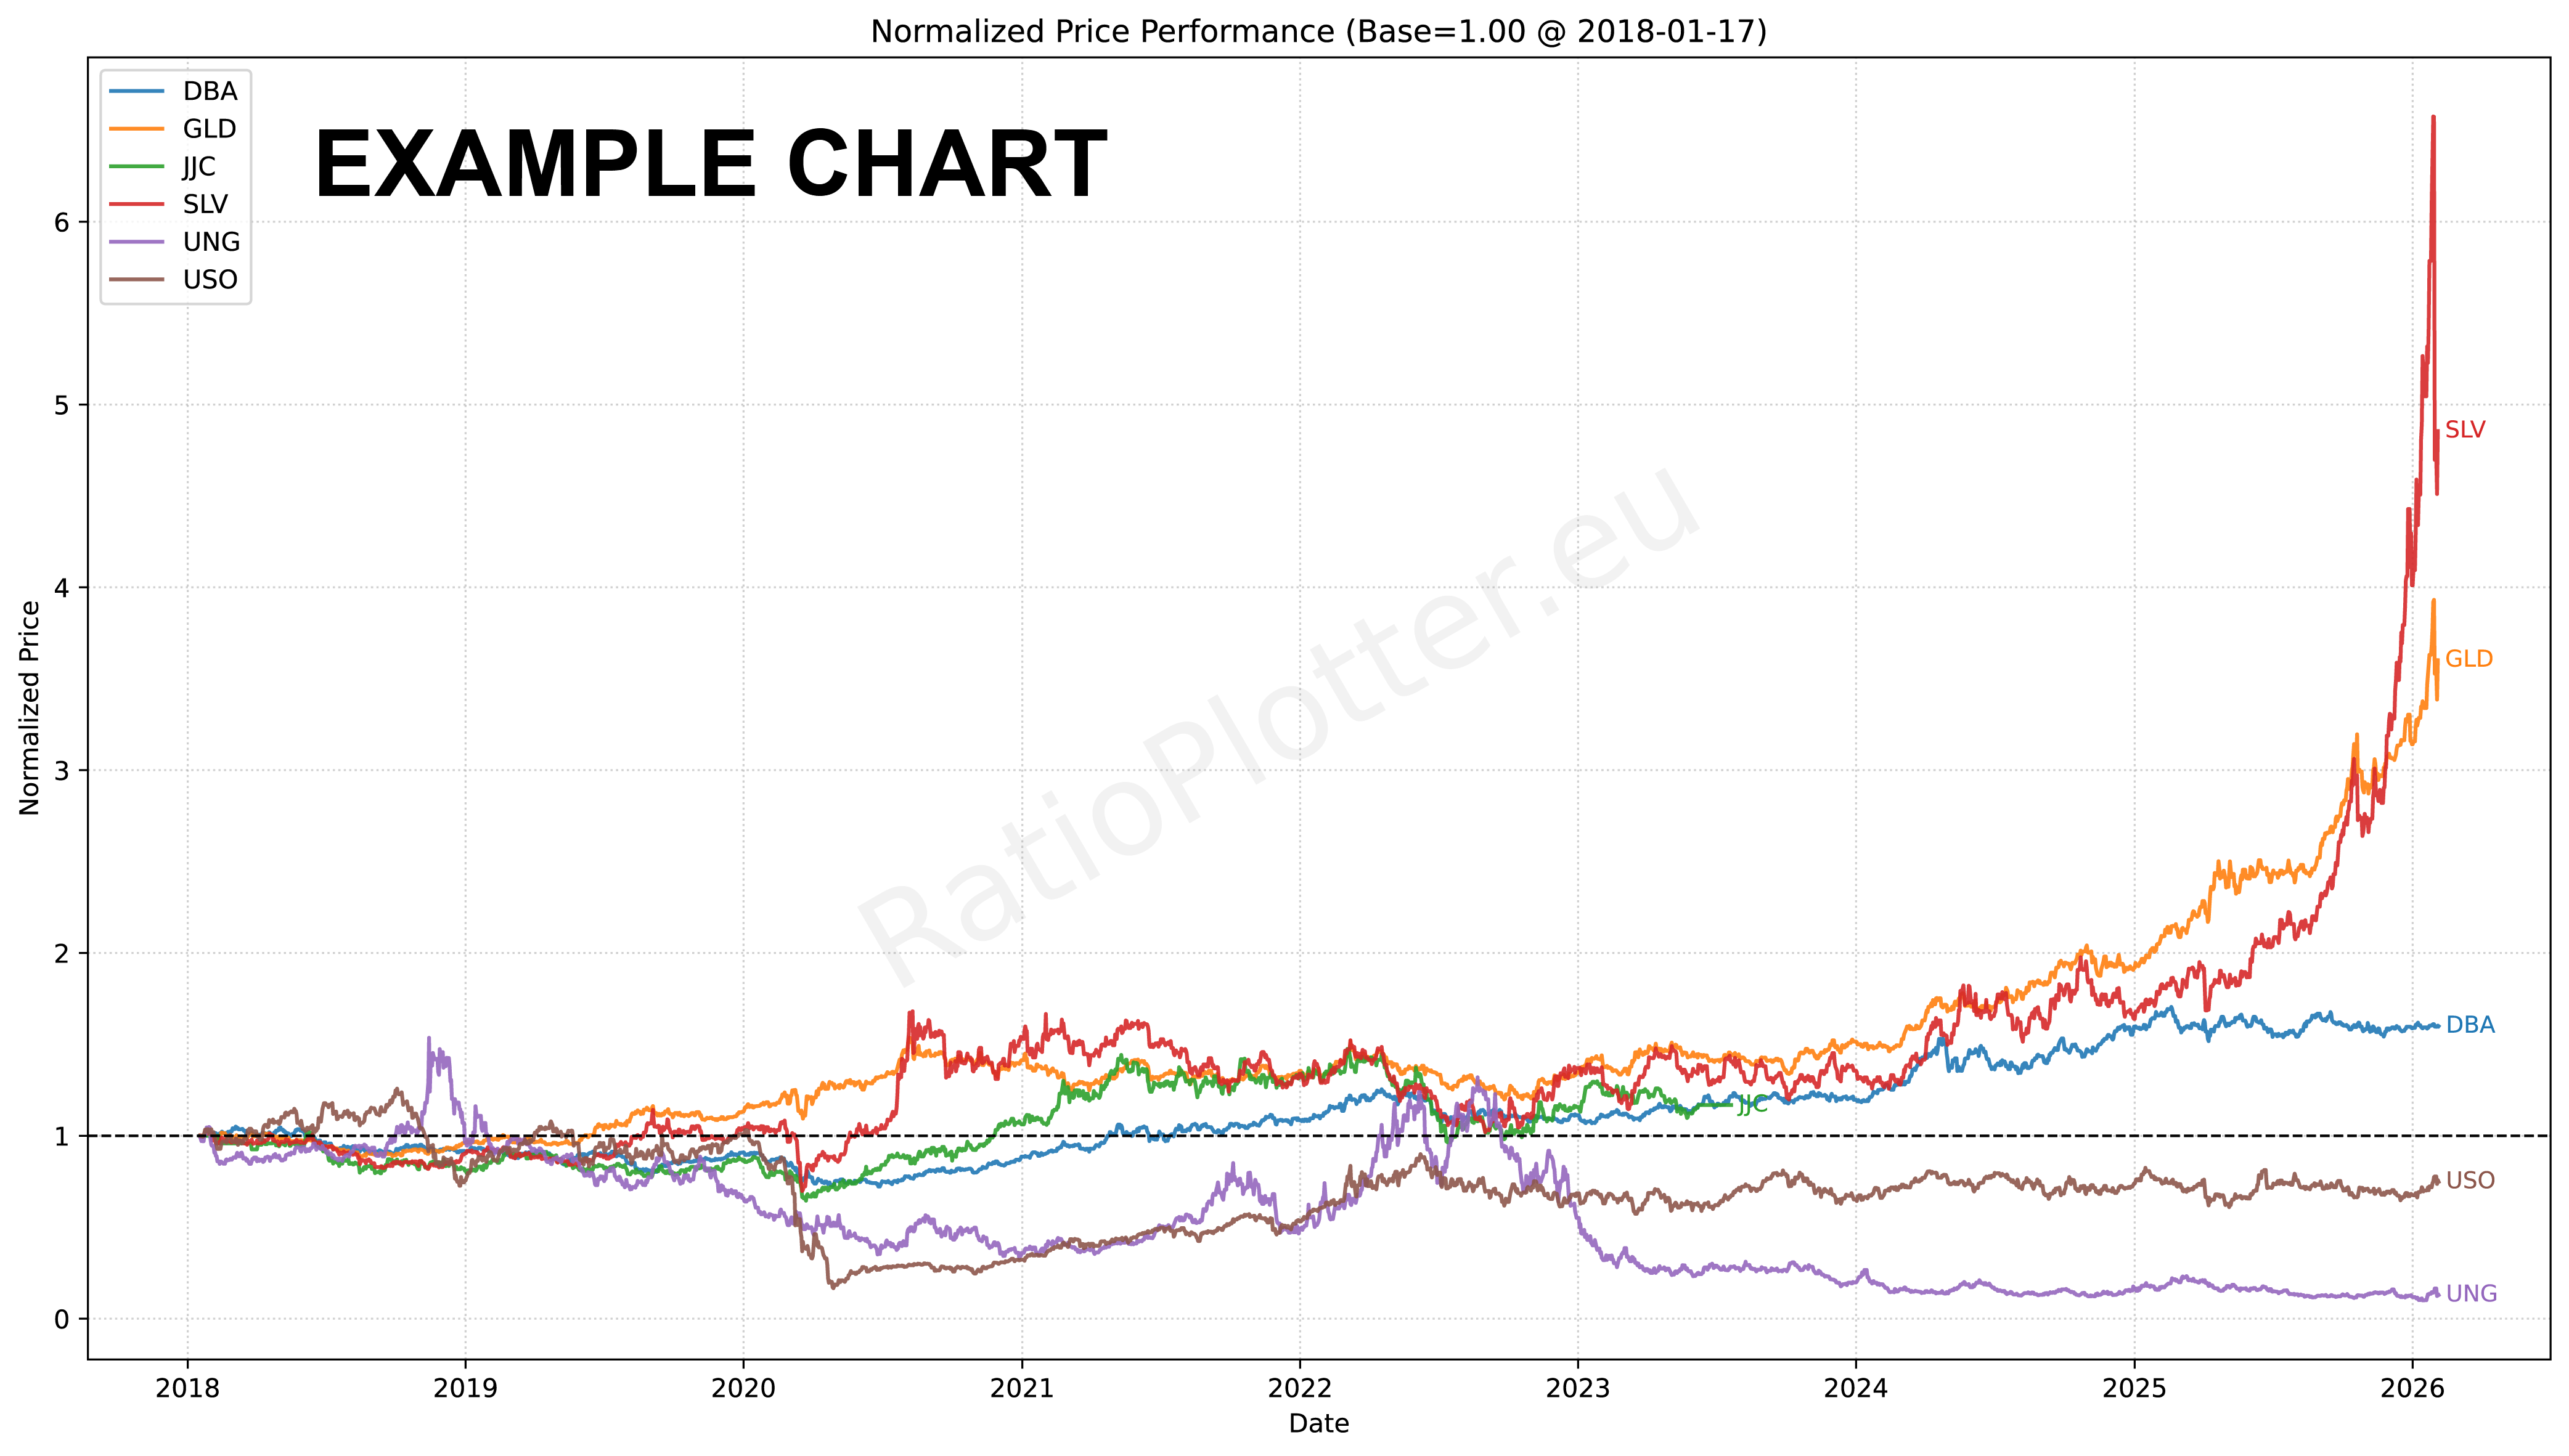
Normalize and compare up to 10 tickers on a single chart. All prices are rebased to 1.0 at the common start date.
Load Presets (Free Tier)
Trading Notes & Guide
Help & Notes
Normalization (Base 1.0): This tool takes multiple assets with different prices (e.g., Apple at $200 and Ford at $12) and divides them by their price at the start date. This makes them all start at 1.0, allowing you to see pure percentage performance comparison over time.
Common Start Date: The chart automatically finds the earliest date where all requested tickers have valid data (the intersection). Any data prior to this "Common Start" is trimmed to ensure a fair comparison.
Limit: The Free Tier is restricted to specific pre-defined baskets (Magnificent 7, Global Indices, Commodities). Custom baskets are available in the premium version.