
Plot Custom Equation
Enter tickers and coefficients (e.g., 1.0*GLD + 0.5*SLV - 1.0*USO)
Popular Equations (Free Tier)
Notes & Guidelines
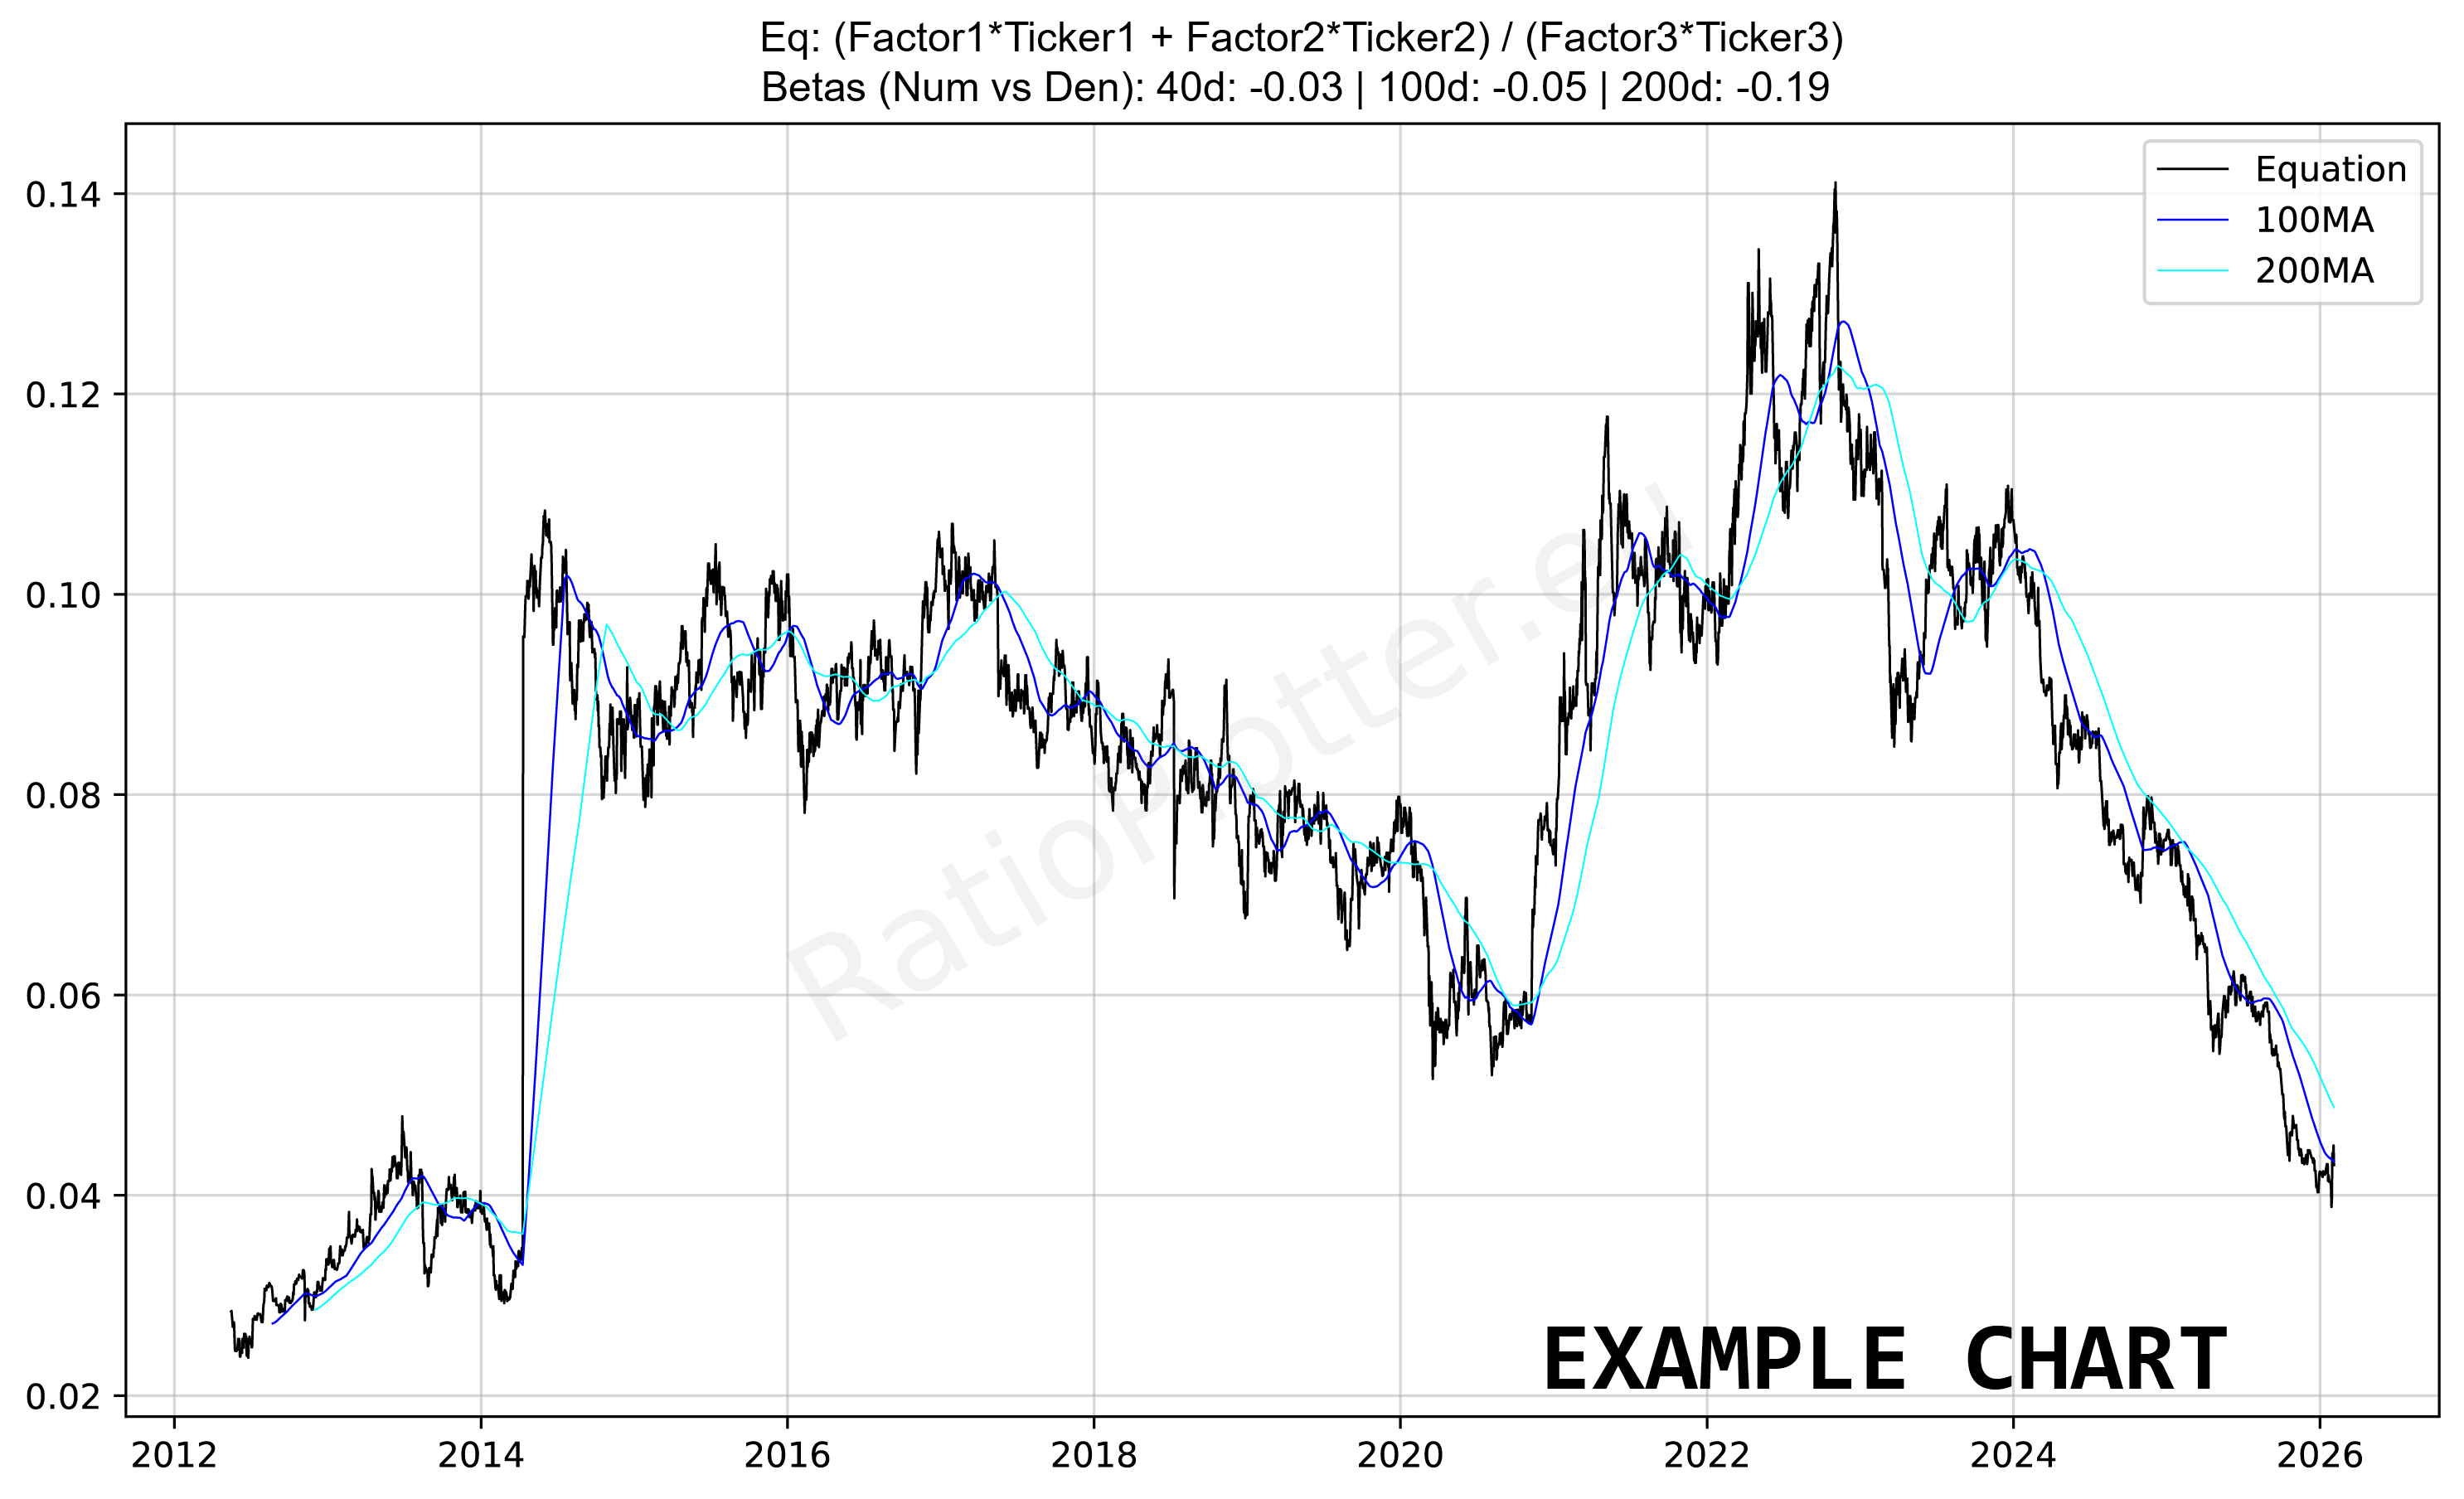
Logic: This tool calculates a custom index. The formula is:
Coefficients: Must be numbers (e.g., 0.5, -1, 100). If you want to subtract a ticker, use a negative coefficient. Notice in the formula that the coefficients used can alter the results of the plotted chart significantly. For the free version we have hardcoded the coefficients we think are best, but this may be flawed. To fix this you will be able to change the coefficients to your liking when we release the paid version of RatioPlotter with no limits.
Tickers: Use valid standardized financial tickers. If a field is left empty or coefficient is 0, that term is ignored.
Currency: Ensure tickers are in the same currency or the result may be distorted by exchange rates.
Example: 1.0*GLD + 0.5*SLV - 1.0*USO creates a synthetic asset that is long gold, partially long silver, and short oil.
Recommendation: Use this tool to create custom baskets or hedged positions for analysis.