
Seasonality Plotter Interpretation: Small Caps vs Large Caps
One of the most powerful market forces is Seasonality. See this article from the European Financial Review on how leveraging these cycles can provide a strategic advantage.
These seasonal effects can be predicted and used to an investors advantage. In this article we will cover how to visualize a seasonal trend, how to validate it, how to spot where the profit is made and how traders turn this into a strategy.
One of the most well known seasonal effects is the January Effect. This effect is most pronounced in small cap stocks, which are often represented by the Russell 2000 Index (^RUT). The January Effect is the tendency for small-cap stocks to outperform large-cap stocks in January.
The "January Effect" has a big issue trapping traders year after year. This issue is that most of the information is outdated. While textbooks say small caps rally in January, the actual price action has shifted earlier over the decades. This is caused by traders trying to get ahead of eachother year after year.
Getting the up to date chart to visualize this "Front-Run" is crucial. This step is where our seasonality tool comes in.
1. Visualizing the "Front-Run"
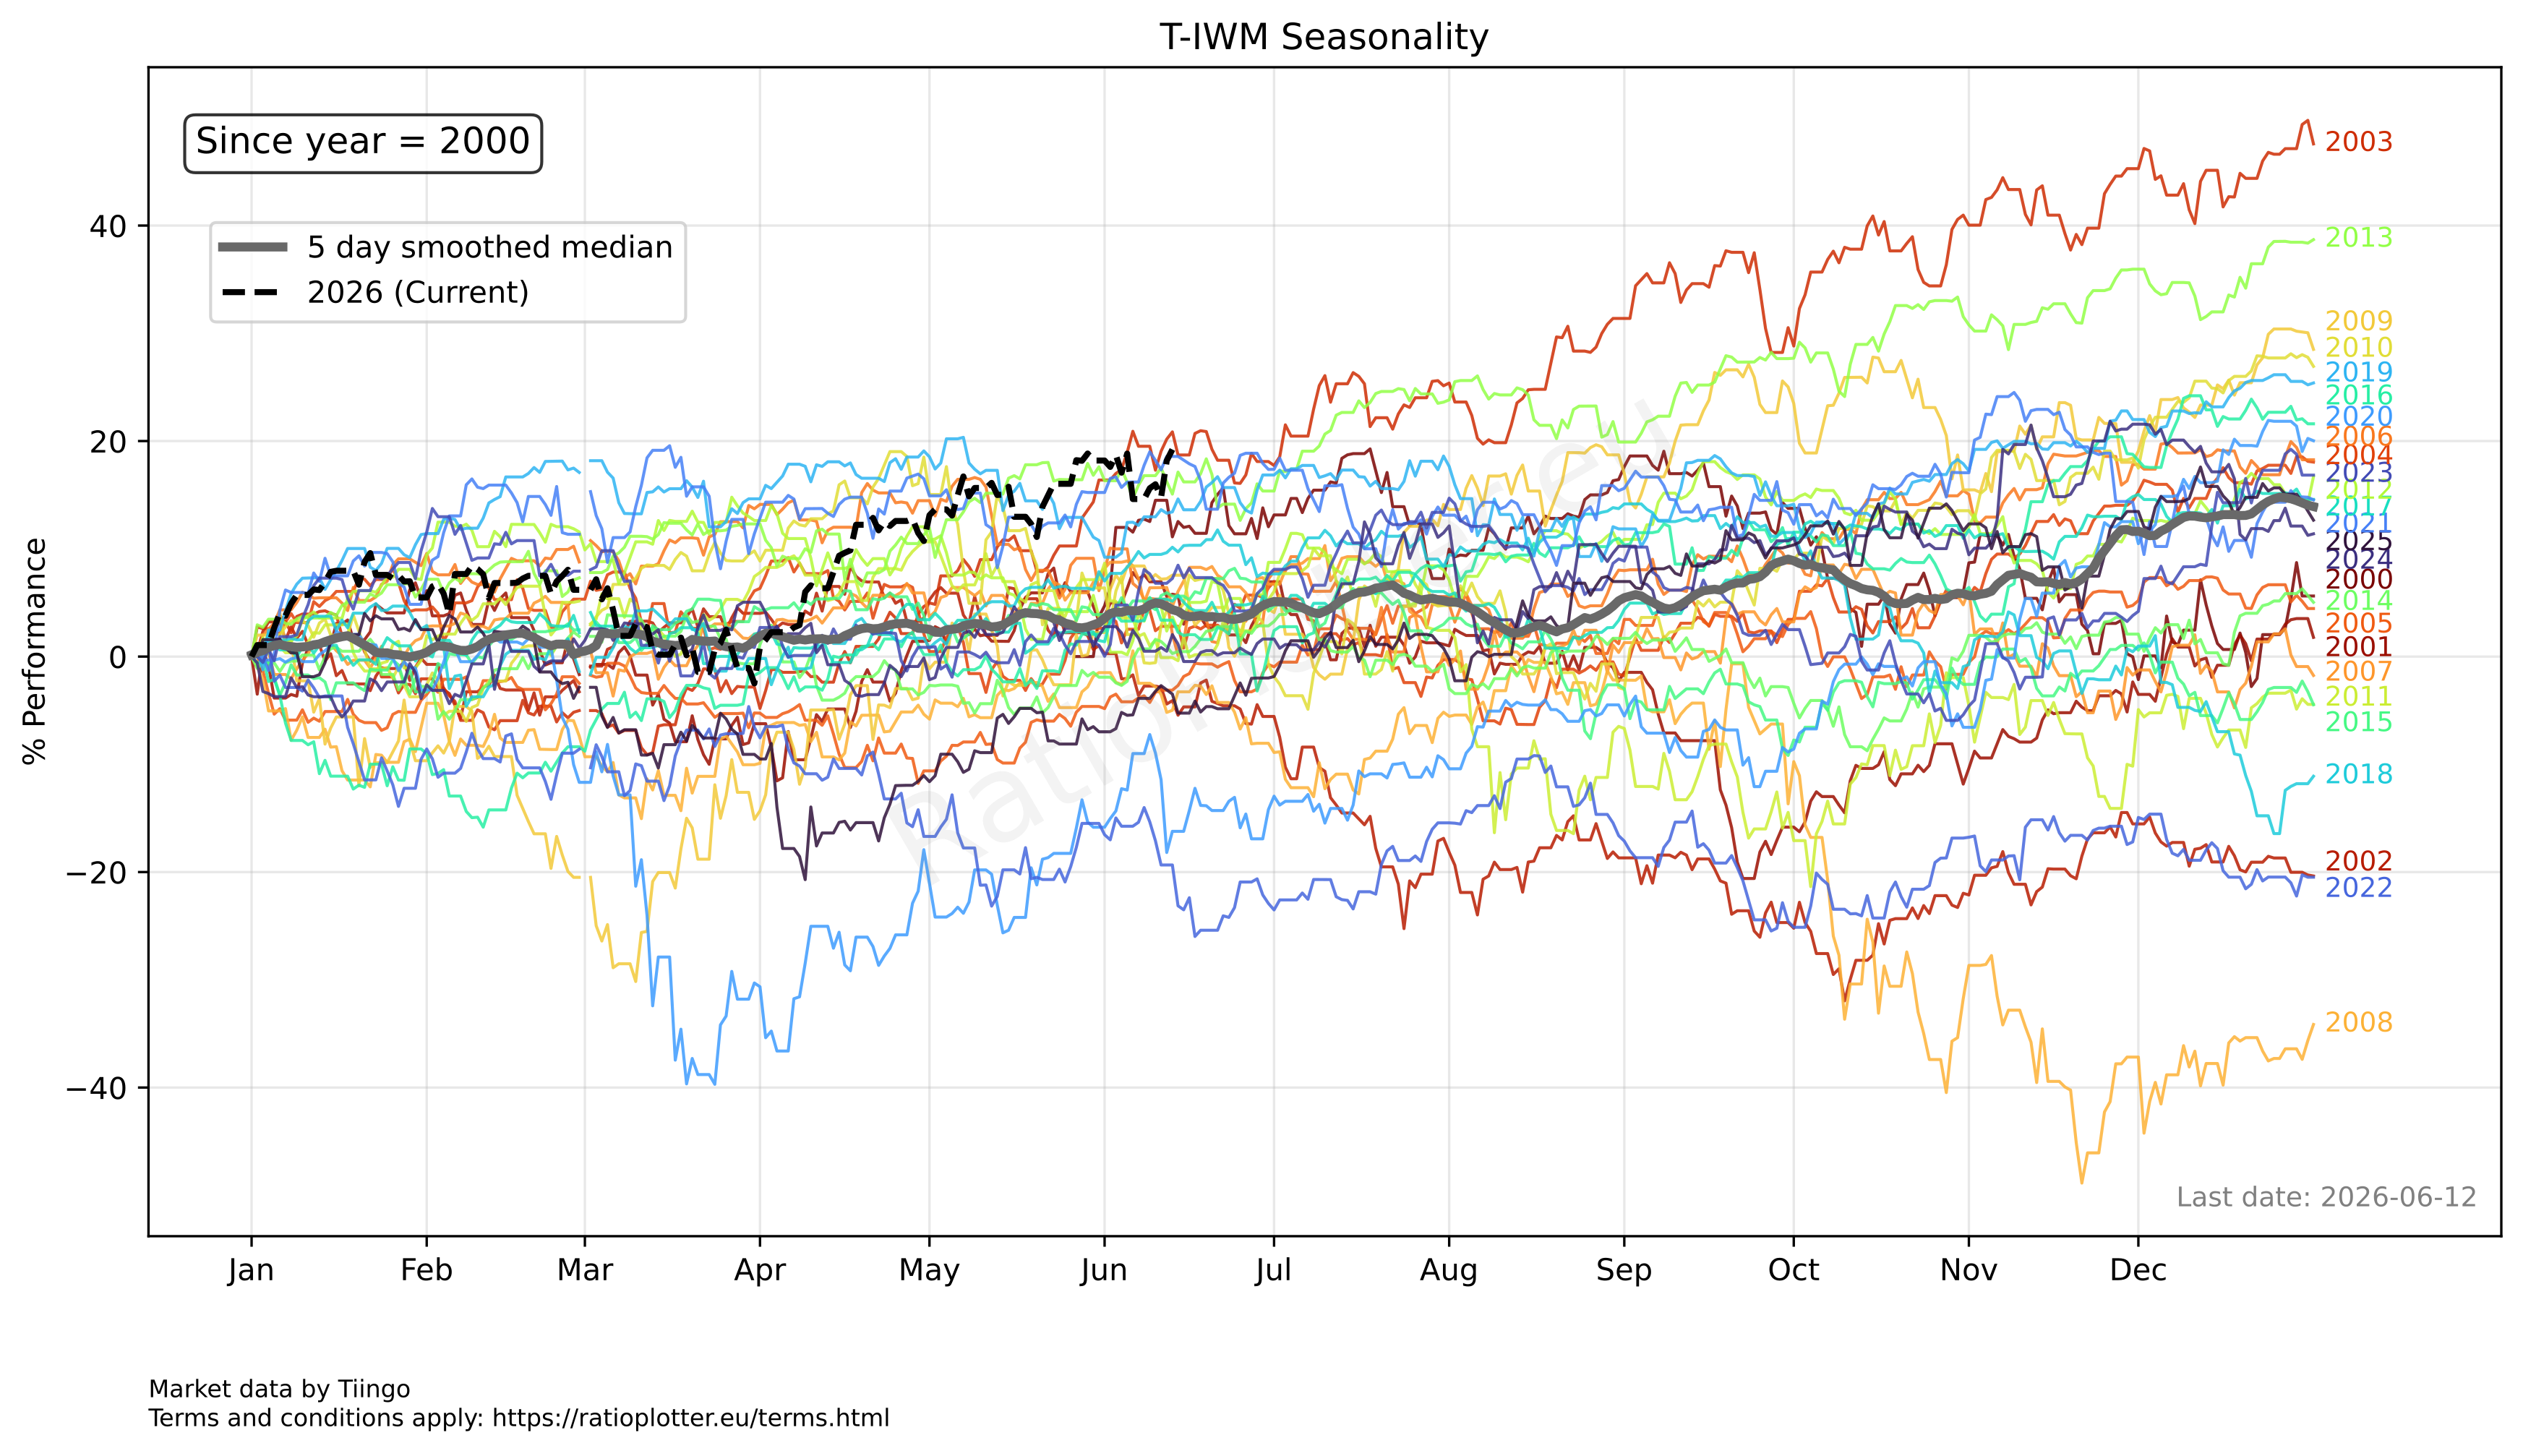
To see the real seasonal flow, you must plot the seasonality of the Russell 2000 Index (T-IWM).
 For the up to date chart click here
Why this Russell 2000 has such great seasonality: Institutional fund managers often go on a buying spree in late Q4. They want their year-end statements to show they owned the year's winners. This creates a consistent bid under small-cap stocks (which are less liquid and move faster) starting as early as November 1st.
Now that we can see the real seasonal pattern and understand why it forms we understand why the "January Effect" is actually more of a "November-December Effect" for small caps. This shift in timing is crucial for traders looking to capitalize on seasonal trends.
To know if we can actually trade this we have to first test the validity of the seasonality. Because otherwise you won't know if you're just trading noise or actual predictable patterns.
2. Plotting the Seasonality Validity Test
To know if this seasonality is more than just noise, we have to statistically validate it. This is done using the Ratio Plotter tool and a special ticker called SEA(). To simplify this we have added a blue "Detrend ticker curve from seasonal effects using ratio plot" button underneath the ticker input fields of each seasonality plot you make.
 For the up to date chart click here
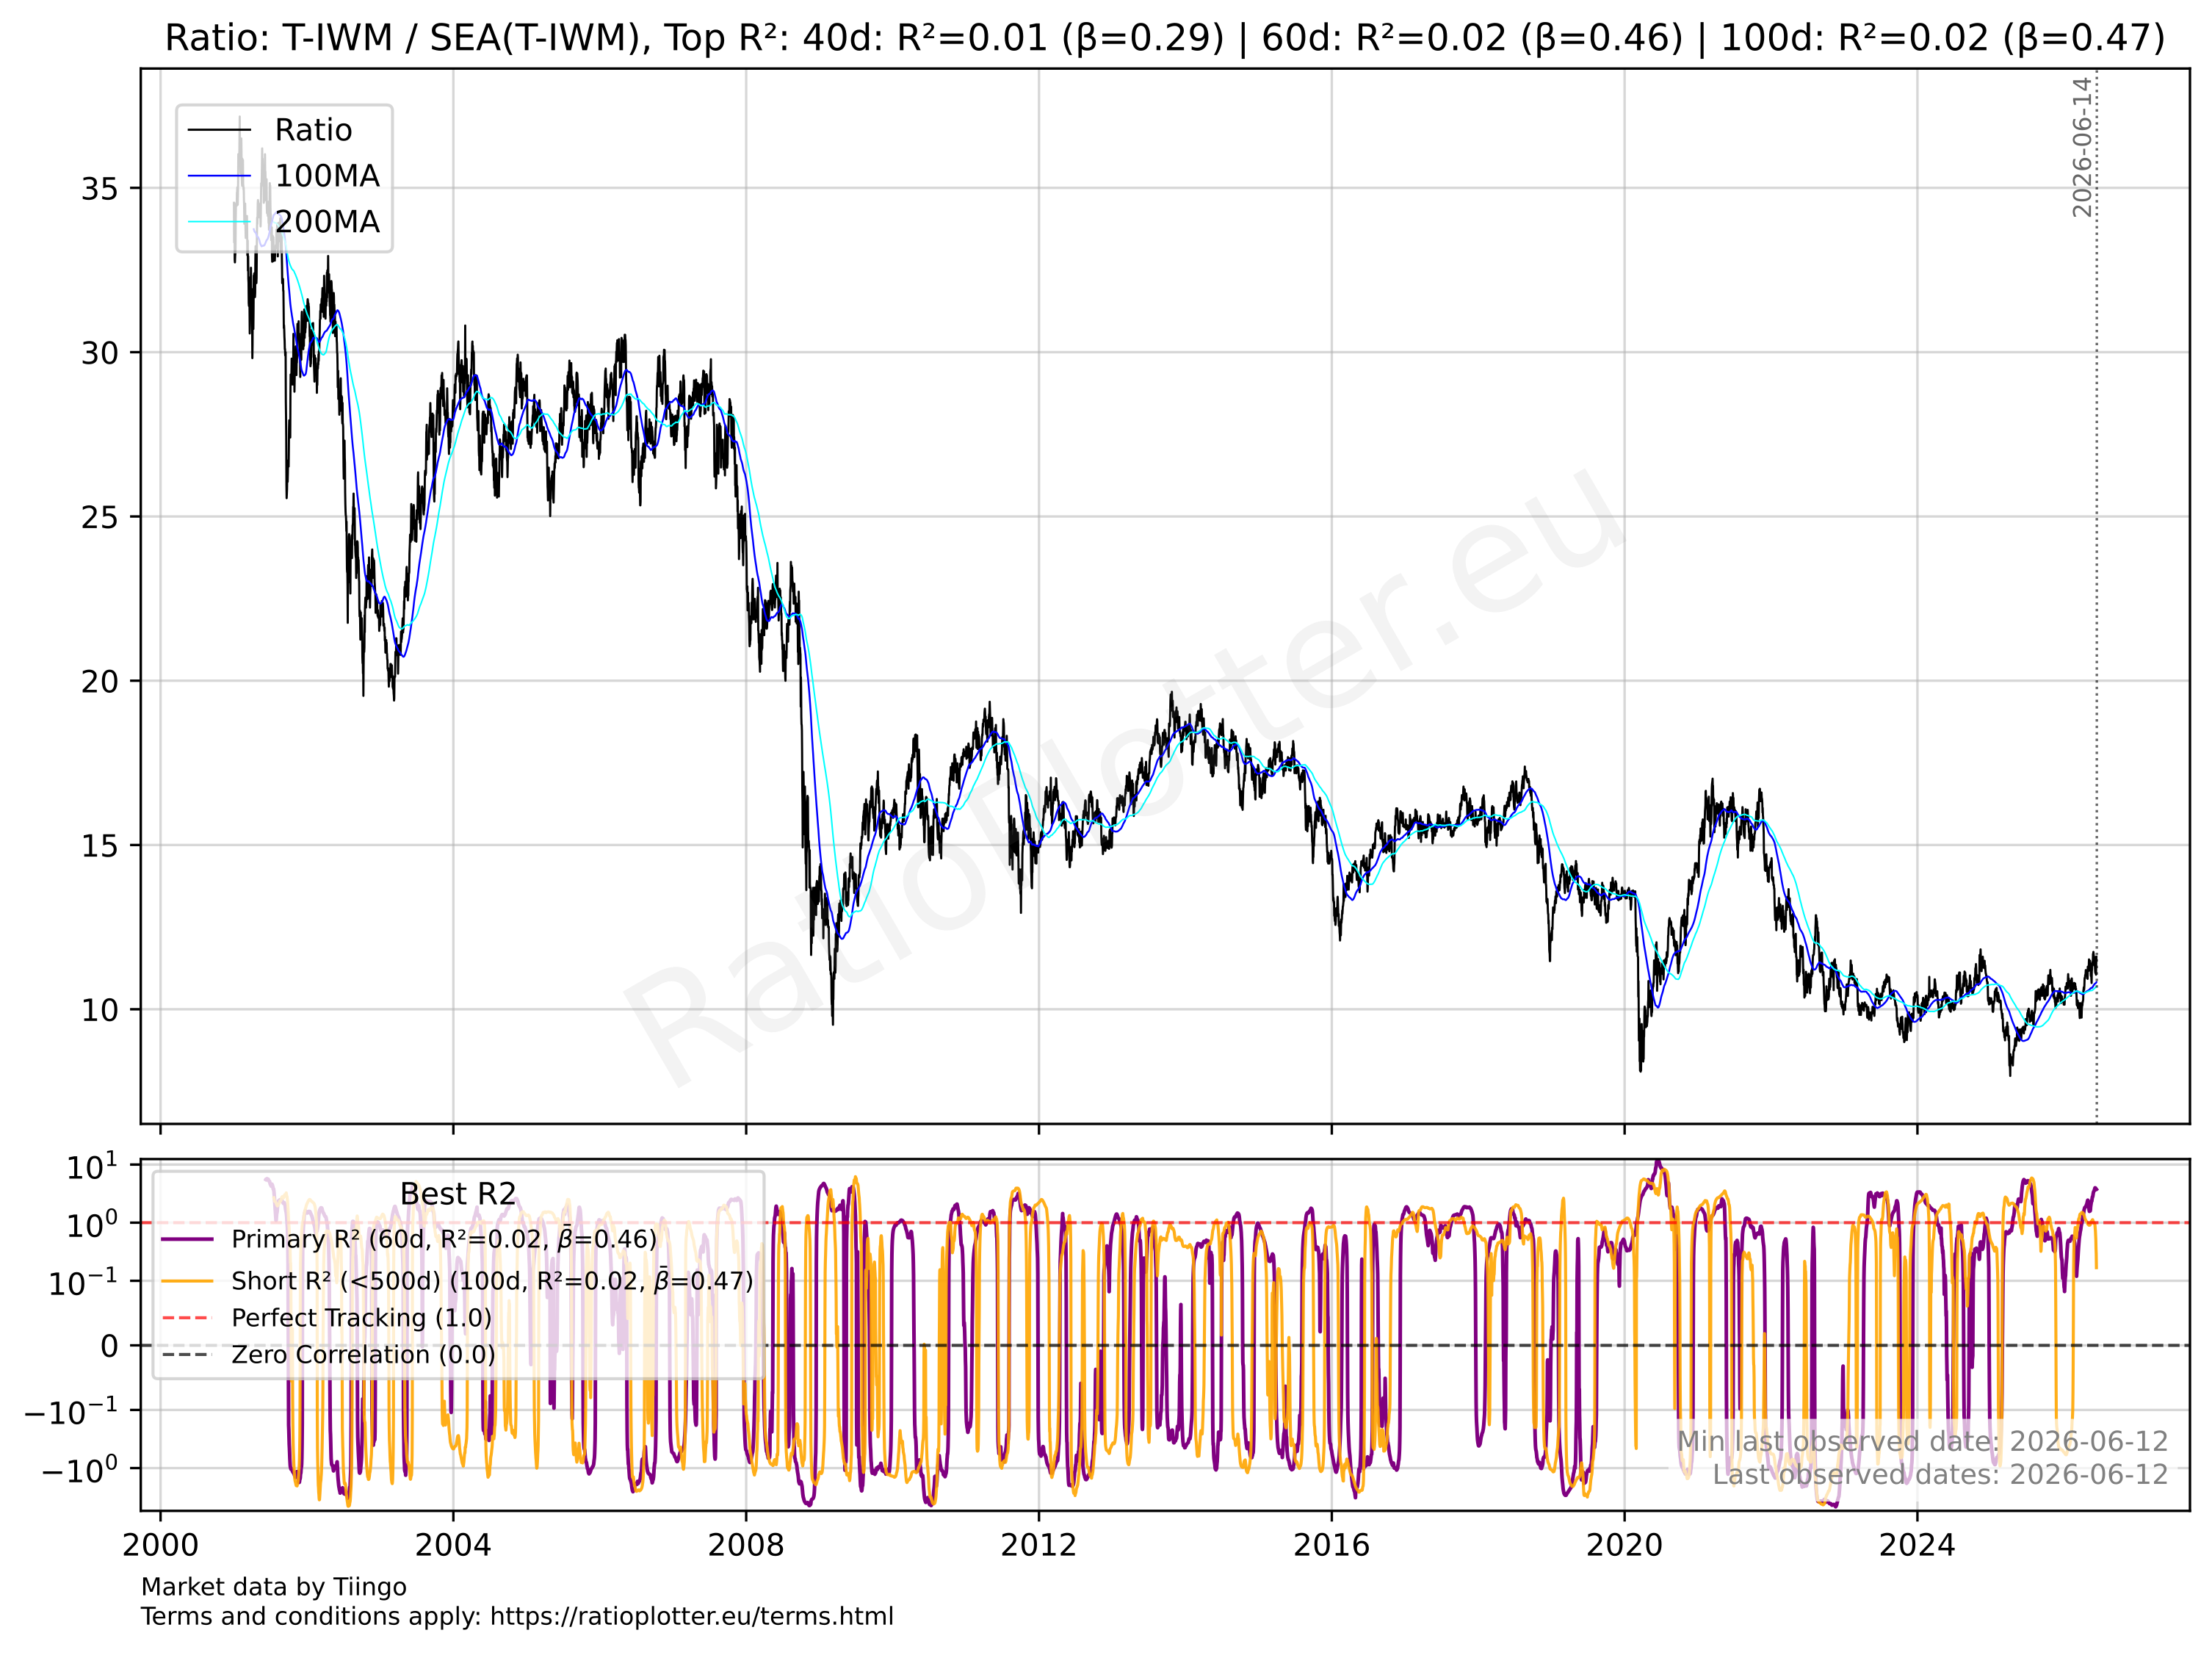
The chart you see above is the ratio between Stock A and its Median Seasonality curve. What we have plotted now is assentially the stock's chart without seasonal effects. This can be seen as a new data series called the Seasonally Adjusted Price.
If the stock goes up exactly as much as its historical seasonality predicts, the ratio stays flat. Which isn't the case for Stock A.
Instead the ratio clearly has a swinging upward trend. When it moves down the stock is underperforming compared to its seasonal expectations and when the ratio moves up its outperforming its seasonal expectations.
3. Validating the Seasonality
When validating the Seasonal effects of a stock the R2 and Beta are the most important factors.
The Beta measures how much an asset moves relative to a benchmark. Where in the seasonality validation chart the benchmark is the stock itself and the asset is the seasonality of that stock.
We use the R2 as a measure of correlation between Asset A (the Russel 2000 index) and Asset B (the seasonality of the Russel 2000 index). Where the value for R2 represents the percentage of variance in one asset that can be mathematically explained by the other.
As you can see the seasonality validity test gives a Beta of 0.46 for the 100 day rolling window.
This tells us that over a 100-day window, when the denomirator (the seasonality of the Russel 2000 index) moves up 10% the numerator will move up 4.6%!
This means that only 2% of the stock's price movement can be mathematically explained by its seasonality. This is a very low value and indicates that while there is some relationship between the stock and its seasonality, it is not a strong one. In other words, the stock's price movement is largely independent of its seasonal patterns.
This leaves us in a bit of a conundrum. The Beta and literature tell us that there is a significant relationship between the stock and its seasonality, but the R2 indicates that this relationship is not strong enough to explain much of the stock's price movement.
An explination for this discrepancy can be that the for the first 10 months of the year the Russel 2000 index has zero seasonal effects. This only leaves the last two months of the year with seasonal effects.
Two months are of course a very small part of the year and thus won't be reflected in the R2 which is calculated for the entire year. Doing a statistical analysis of R2 is impossible because no such tool exists. So what do we do now?
4. Manual Analysis
To get around the issue of the R2 being calculated for the entire year we have to do a manual analysis of the seasonality. This is done by looking at the seasonality plot and identifying the periods where the stock is outperforming or underperforming its seasonal expectations.
Looking at the seasonality plot of the Russel 2000 index we can see that there is a clear upward trend in the ratio from November to December. So for this period we will count how many times the Russel 2000 index went up and how many times it went down. The baseline from which we will decide if it went up or down will be the value at the 1st of Novemeber.
After some careful counting, the results are that the Russel 2000 index has moved up between November and December 26 times and down 10 times. Resulting in a 72%chance the Russel 2000 index moves up and a 28% chance the Russel 2000 index moves down between November and December. Doing the same from the 1st of December to the 31st gives us 26 up and 11 down which is practically identical.
This gives us a pretty clear picture that although the seasonality for the entire year is oure noise, the seasonality for the 1st of November to the 31st of December has a high probability to be valid.
5. Strategy
An article can tell you to buy small caps for the winter, but it won't tell you that the "easy juice" is often squeezed out before Christmas.
Blindly trusting a trading oppertunity or strategy you read in an article is a dangerous game. You should keep the fact that thousands of other investors have read that same strategy, this will often lead to you losing money instead of making it when blindly trusting the strategy.
Instead, you should analyze the oppertinity youself, validate if its truly predictable and then use some common sense to find out if the validation is true and to decide the timing of your entry position.
In conclusion:
Oppertunity: The "January Effect" is actually a "November-December Effect" for small caps. This creates a predictable seasonal pattern that can be exploited for profit.
Scenario: Use the seasonality tool to time the "Front-Run."
Validation: Use the Ratio Plotter to validate the seasonality and understand how much of the stock's movement is driven by seasonal factors.
Common Sense: Use your common sense to analyze the charts and decide on the validity and timing of your trades. Don't blindly trust a strategy or validation, but use the information you have to make informed decisions.
Traditional Analysis: Make sure to also do your traditional analysis of the index such as the PE, Dividend and Buffet Indicator of it's contry to minimise risk. Seasonality is just one factor to consider when making trading decisions.
Entry: Look back at the seasonality chart to find the best entry timing.
Exit: Look at the seasonality chart and find the best exit point. This is often before Christmas when most of the "easy juice" is squeezed out.